Anecdotally, I’m hearing a fair amount of pessimism in regard to the market’s performance over the last two trading days. Those expecting some exuberant follow through in the S&P 500 are disappointed, even though the rally off the 2/11 low was around 8%. For a respectable large cap index, that’s a hefty bounce.
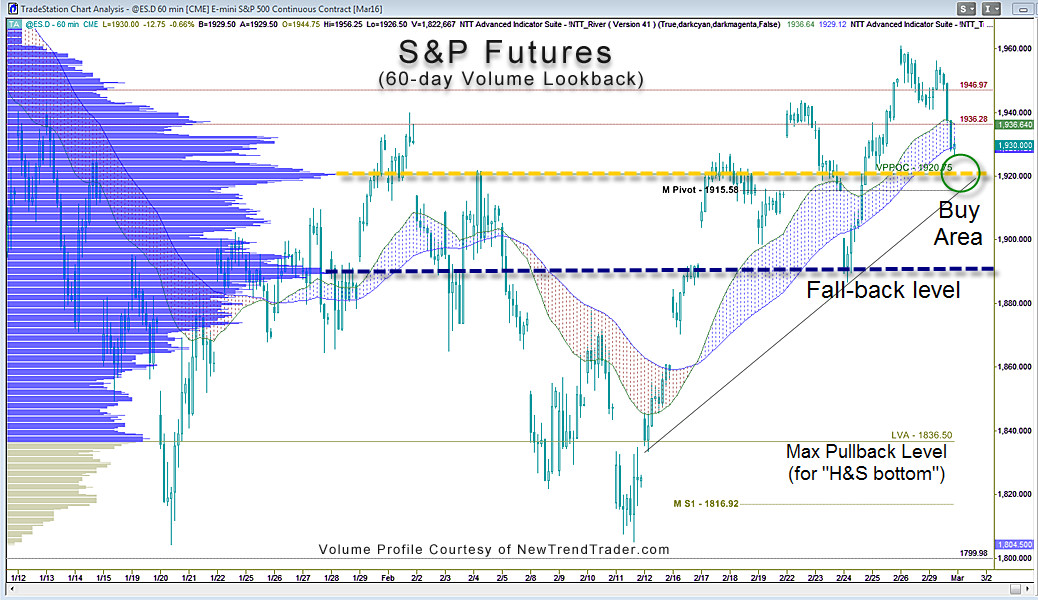
I don’t share the glass-half-empty perspective for several technical reasons. First, the S&P futures are above their Volume Profile Point of Control over the last 60 trading days, which is 1920. That level is still important technical support.
In that region one also encounters support from the monthly pivot and the up-trend line from the February lows (circled in green). This is a technical trifecta that should be respected for now.
If the uptrend line is broken, however, and price moves decisively below 1920, then there is a ‘fall-back’ support zone at 1890. It has a very strong volume ledge similar to the VPPOC itself. If that were to fail, then the price gap between 1860-1870 would be next downside target. By the way, the LVA at 1839 probably represents the deepest possible ‘normal’ pullback, i.e. one that would not trigger forced selling by hedge funds.
While there is no way to accurately predict the market’s downside trajectory, presently, however, the bulls have the football and the benefit of the doubt. Although I expect more downside in the short-term, if you find yourself growing increasingly skeptical of this market by the day, you may be lulling yourself into a bear trance.
Objectively, the S&P is in a trading range. That means one should expect flip flop action from bull to bear and back again over the course of a few weeks. Basically, it’s a trader’s market until further notice. No harm, no foul.