

In our last post about the U.S. Dollar in early January, we showed how the Dollar Index (DX) should decline into support areas before it attempts to climb in a fifth wave. As of now, the structure of the decline appears complete.
After the Dollar’s steady climb in 2014, much of 2015 was spent in a complex corrective fourth wave. On the chart below, you can see how wave (iv) took the form of three connected segments, each with three internal sub-waves. The 3-3-3 structure can be considered complete with the recent lower high. Additional confirming evidence that the correction is finished can be seen in the way this week’s high overlaps the index’s low of last December.
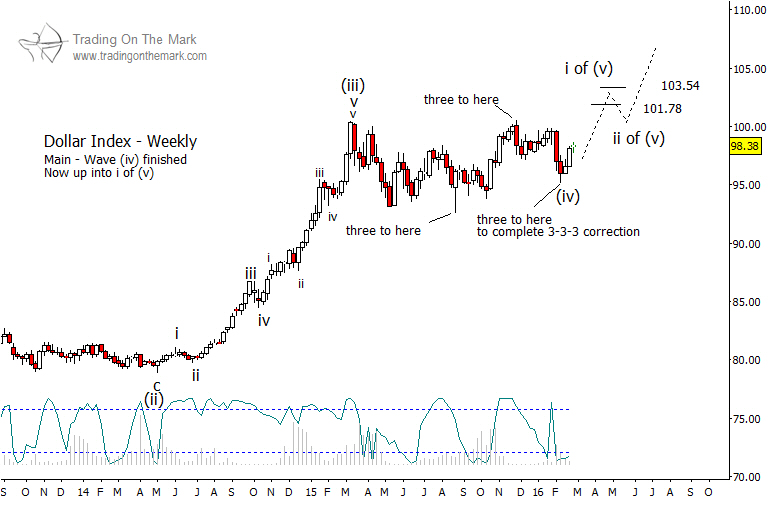
Looking forward, we expect upward wave ‘i’ of (v) to test one or both of the target areas near 101.78 and 193.54 during the first half of 2016. After that point, we might see some consolidation in DX for a few weeks or months before it works its way higher.
Our newsletter this month discusses the big picture in interest rates and treasuries. Click here to request your copy!

