With a triple digit P/E ratio, negative cash flow and growing competition, Netflix is the more speculative member of the FANG gang. That’s why 13% of the float is sold short, whereas less than 2% of Amazon’s float is shorted. High short interest (greater than 10%) is an indication of significant skepticism on the part of hedge funds.
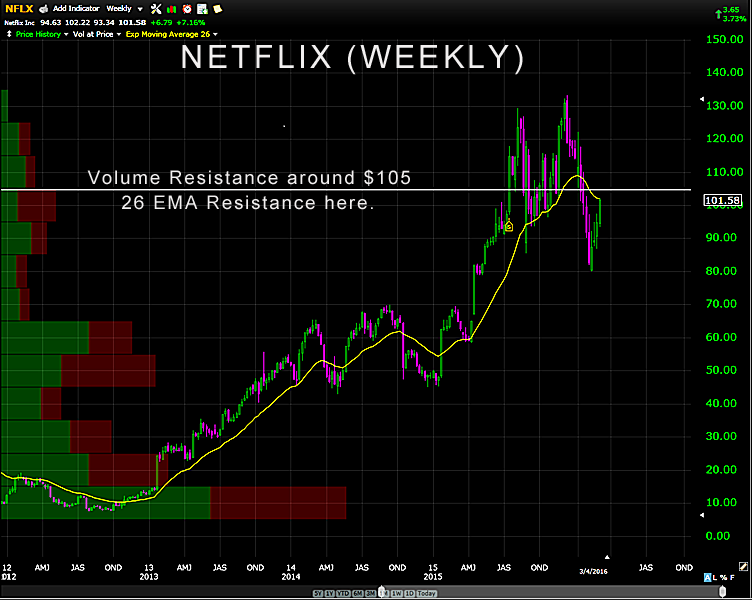
Netflix was one of the weakest large-cap tech stocks in January, but it has bounced back nicely. In technical terms, Netflix is now entering a resistance zone, comprised of the 26 ema on the weekly chart and a volume node on its volume profile.
Unlike Apple, which has been basing for two months, NFLX has been stair stepping up since early February and is approaching the top of its up-trend channel on the daily chart (not shown). That’s another resistance level that more or less corresponds with the others.
Resistance (R) is an interesting concept in technical analysis. It functions like a thick rubber wall that restrains price from advancing to higher levels. When it is decisively penetrated, however, it miraculously transforms into support (S). This shift in polarity occurs because so many traders observe and respect the S/R convention.
Therefore, if Netflix closes a couple of daily bars above $105, then $125 is a possible target.
www.daytradingpsychology.com (Coaching for private traders.)
www.trader-analytics.com (Peak performance consulting to RIAs, hedge funds
and banks.)