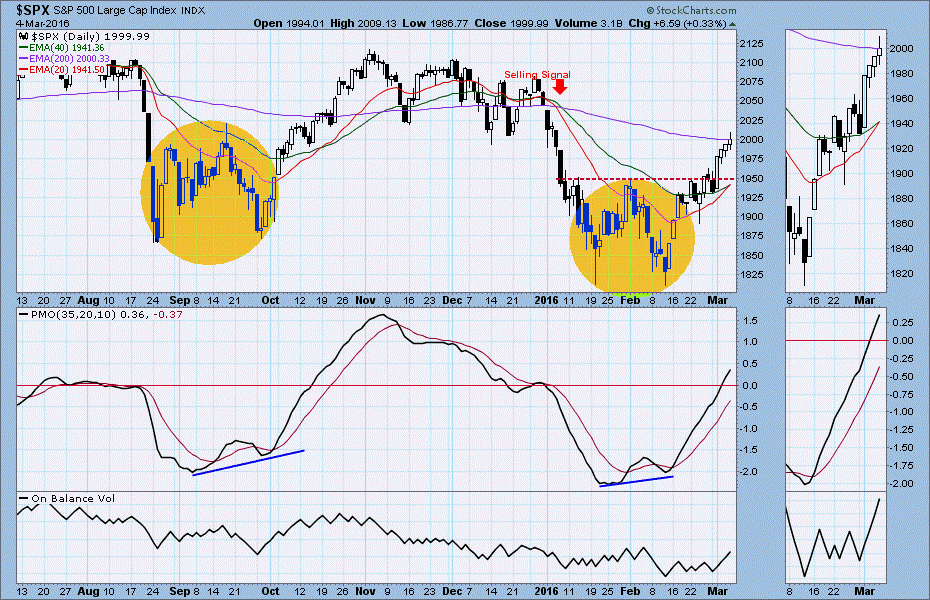
The S&P 500 cash index ($SPX) closed at 1999.99 last Friday, up 51.94 points for a net weekly gain of 2.66%, continuing what has been remarkable rally.
Since it made a low at 1810 on February 11, the large-cap index has rallied about 200 points — if you count Friday’s intra-day high — in 15 trading days.
If you count that same spike high, it has recovered almost all the ground lost in 2016, and is now almost back to where we started at the beginning of the year.
Given that triumphant rush for the top, it is difficult to remember January, when it looked like the bottom was going to drop out at any moment.
So what’s real, the bust in January or the recovery in February? Short answer: both.
The market is repeating a move it made starting in July last year, and despite the razzle-dazzle of the last couple of weeks, we’re still looking at this as a rally in a bear market.
The SPX closed Friday almost exactly at the 62% Fibonacci retracement from the November high to the February 11 low, which was the starting point for this move up.
And for the first time it has entered into the major resistance area from about 1993 to 2020 that was the break-down area of the first-of-the-year decline. We’re back to that area but not through it – yet – so it is a little early to say that the Bulls have regained control.
This is normally the most favourable part of the year for stocks, and that seasonal effect may push the market up a little. But we are looking for a change-in-trend sometime around March 18, and that could be the point where the market finally makes up its mind.
One note-worthy observation: the stock index is marching higher almost in lockstep with oil and gold, and is roughly matched by a corresponding decline in the US dollar index. This could be nothing more than a little FX adjustment.
This week
We should see a minor pullback this week due to an extremely overbought condition in the ultra-short-term and a major daily resistance line just ahead. The mini-futures March contract rolls over this week, which may also cause the price to thrash around a little.
There are relatively few market-moving economic reports due this week, and only one lonely representative from the Federal Reserve will be generously sharing the received wisdom. Even the Middle East looks quiet, for the moment.
We’ve got an intermediate-term buy signal developing but the short term is extremely over-bought and the opposing forces could resolved in a back-and-forth sideways move. But keep an eye on the 1940-50 area; if the price breaks down from that point this short-term up-trend will be badly damaged.
On the upside, the 200-day moving average is around 2023. If we get to that point some of the early longs will be taking profits … and likely stalling any further rally.
Today
We use the S&P500 mini-futures (ES) for our short-term trading.
On Friday the ES moved into its key resistance zone for the first time since it broke below December’s low on Jan 6. 2016. It closed right on the 62% Fibonacci retracement level.
So far the price action remains strong and odds may still favor the up side while we remain in the favorable season. But the indicators are moving into overbought territory.
Friday the price movement made a small reversal sign that was not confirmed by the closing price. Today we may see the ES repeat Friday’s move in the early session. 1985-83 will be first key level to watch. Holding above it will lead the ES to retest last Friday’s high area 2005-07.
As long as the ES stays in or close to Friday’s range, we’ll be selling the tops and buying the bottoms of the range.
A break below 1968.75 will be bearish. A break above 2007 will run stops and push the price higher toward the 2014-16 zone where we may see some profit taking.
Major support levels: 1968.75-66, 1950-45, 1923.50-21, 1907.50-03.75, 1893-92
Major resistance levels: 2003.50-2007.50, 2014.50-16.75, 2029.50-35.00
Visit www.naturus.com to see Naturus.com’s full outlook for the week ahead, free of charge.