
After trading as low as $27.56 oil reversed course and headed higher, it is now in a transition phase; moving from a down trending phase to a bottoming phase. Oil did not close below $30 on a monthly basis, so the outlook has not changed. The current bottom has all the signs of a fake bottom, meaning that it is probably a setup for the early bulls. Oil is likely to test its lows once again before a bottom takes hold. A bottom could take hold in the month of February. Oil, however, cannot close below $30 on a monthly basis, if it does, then the bottoming process could be delayed. Market Update Jan 31, 2016
Oil bottomed out in February and, more importantly, it did not close below $30.00 on a monthly basis. Going forward for the outlook to remain positive, the same rule applies. Oil can trade below $30.00, and this will have no impact on the longer term outlook as long as it does not close below this level on a monthly basis. We are going look at oil in three different time frames and you will note that in all three, $30.00 represents an important price point, and this is why oil should not close below this level on a monthly basis, as former support will turn into resistance.
Oil price 5-month chart 2016
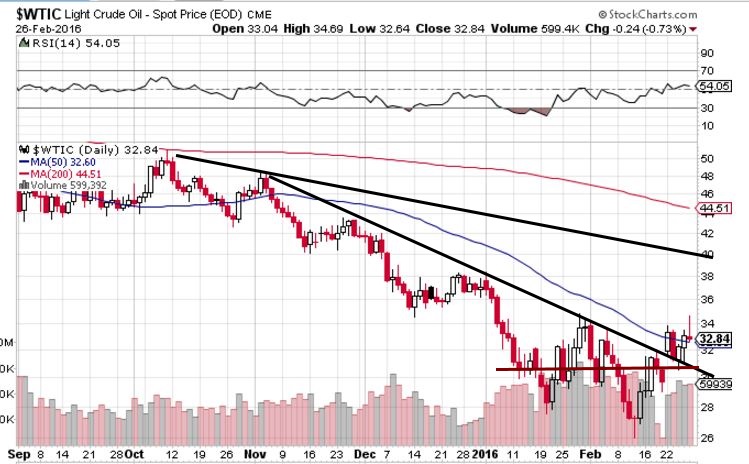
We can clearly see on the 5-month chart that oil should not close below 30.00 on a monthly basis. In the short time frames, oil is slightly overbought so after a possible test of the 35.00 ranges, oil could drop down to the 26.50-28.00 ranges before trending higher. This sudden reversal is a set up to knock the early bulls out and full the bears that the market is going to crash.
Oil prices one year chart
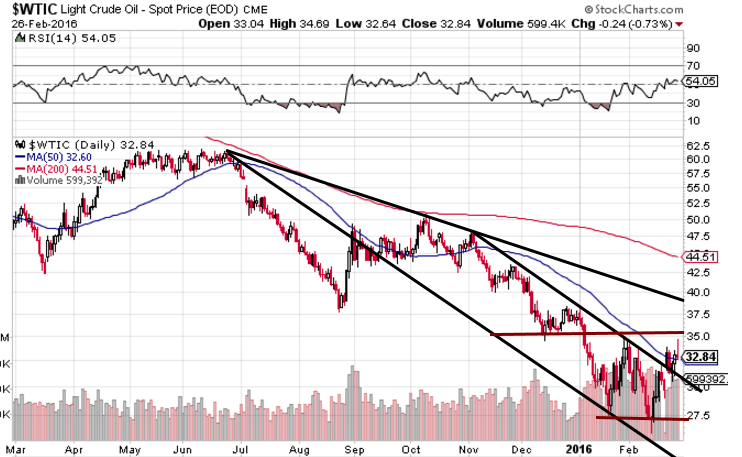
Key price points to focus on the one year chart. A weekly close above 35.00 will lead to a fast move to the 40.50-42.00 ranges, before pulling back.
Oil Prices five-year chart
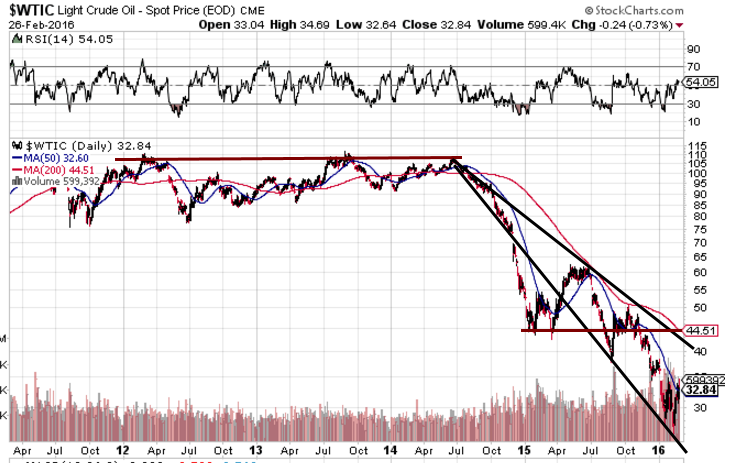
What oil needs to do is trade at or above current support and challenge former resistance levels. Oil prices move to new lows suggests that Oil will most likely test these lows again. However, the focus should no be on oil dropping to new lows but on oil not closing below $30.00 on a monthly level. As long as it can hold above this important price point on a monthly basis, the outlook will favour a slow move up to higher prices.
Key price levels for oil on the five-year Chart
Oil must hold above $30.00 on a monthly basis.
To indicate a move to move to the $55 plus ranges, oil would need to close above $43.50 on a weekly basis.
Conclusion
The current action in oil is promising, and it appears that oil is ready to start trending upwards; the next obstacle for oil is to close above $35.00 on a weekly basis. It is a bit too early to jump into oil stocks now, as any price below $40.00 is devastating to most small to medium sized oil companies. If you are willing to take on a bit of a risk you can position trade in some of the large multinational companies such as TOT, SSL, STO, etc.
When is a crisis reached? When questions arise that can’t be answered.
Ryszard Kapuscin

