In the last week of February, my measure of the breadth average (10-day average of the advancing issues minus declining issues) gave a clear sign that the stock indices had more upside dead ahead.
The breadth average had matched the highest readings of the last 2 years. Considering this fact, it was logical to expect that an upside break above resistance levels and further rally in the indices was forthcoming.
Click here to watch a video explaining how to read the stock market using volume at price.
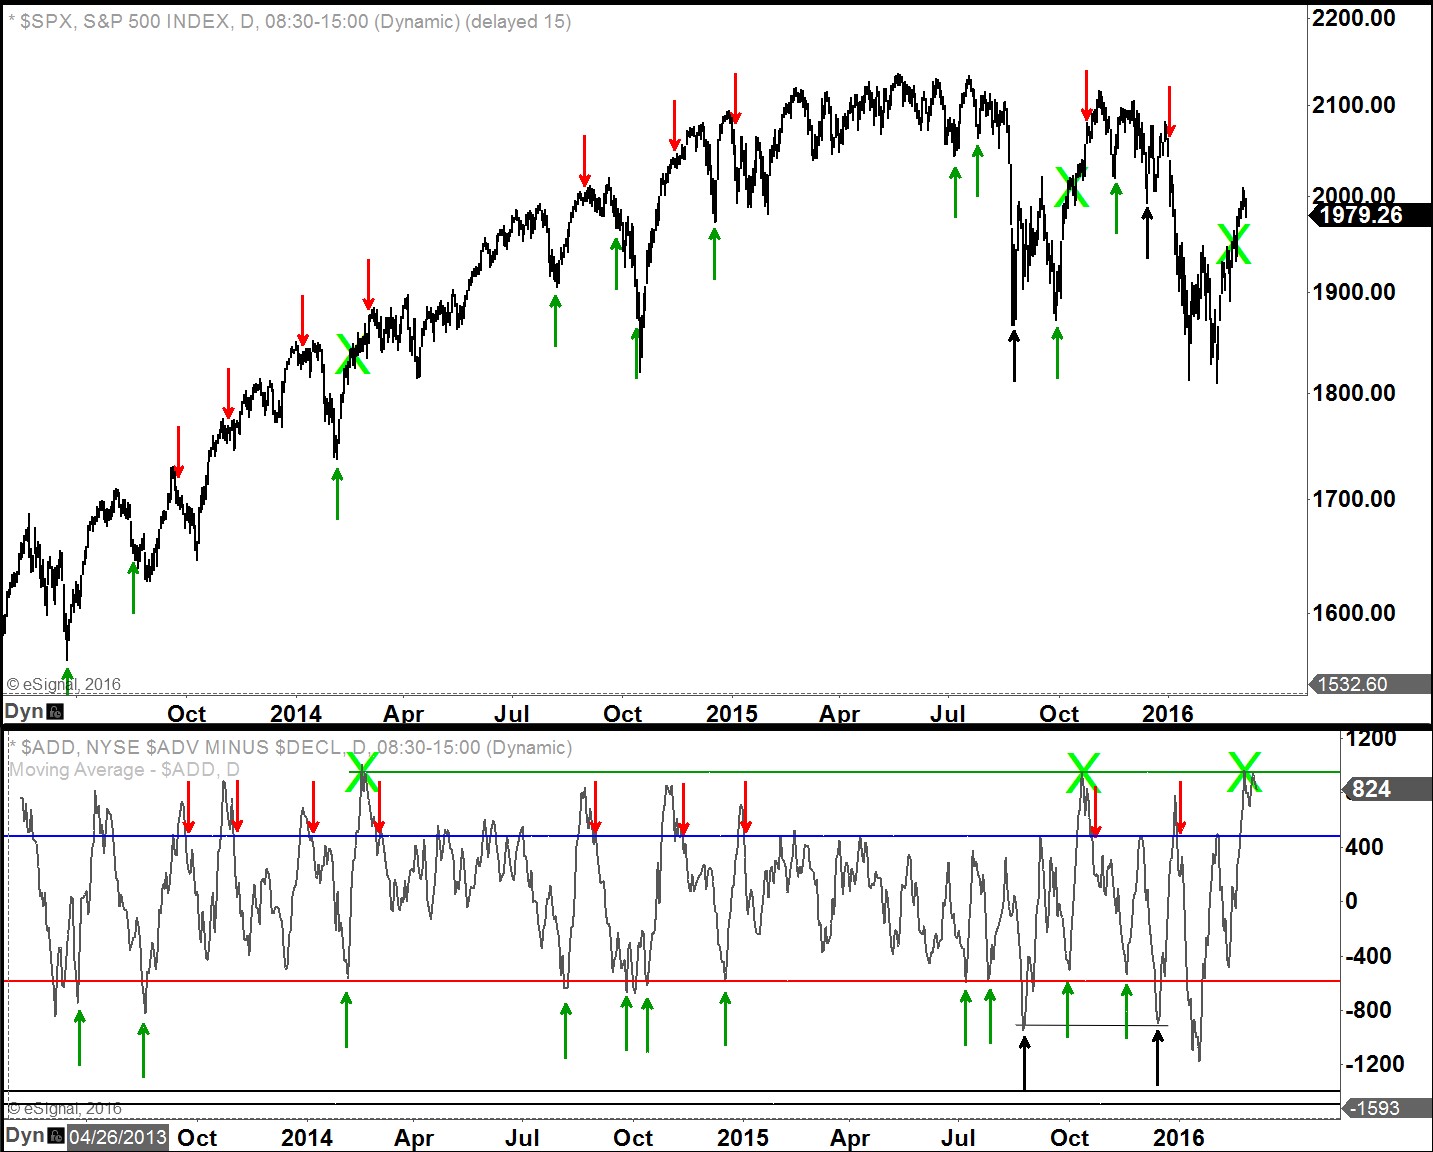
In the attached chart, I’ve highlighted breadth and price areas with green X’s to pinpoint where prior instances of robust breadth average readings occurred. You can see that in both prior cases as well as the current case, the S&P 500 continued higher in the near-term. Additionally, neither of the prior cases of strong breadth readings were quickly followed by any substantial selling/declines. The message here is that the bulls are back and if history is any guide, it will take some time before bears resurface in any serious way.