

The last two weeks emerging markets (EM) have started to outperform developed markets. For the first time in 2016, EM has also started to see ETF inflows over the last two weeks. Last week, EM saw $1.7B in ETF inflows. ETFs that gained assets were EEM +$812M, EMB +$595M, VWO +$167M, IEMG +$143M, and EEMB +99M. So, is it time to go long EM?
From a valuation standpoint the EEM ETF (iShares MSCI Emerging Markets ETF) has a P/E ratio of 19.19, according to Ishares.com. Meanwhile the SPY ETF (SPDR S&P 500 ETF Trust) has a more expensive average P/E ratio of 23, according to Bloomberg. So, EEM is a bit cheaper than SPY.
For a technical standpoint, EEM has drastically underperformed SPY over the last 5 years (see 1st chart below) and makes for an interesting reversion trade. On the weekly chart (see 2nd chart), EEM has broken a downward trend line, and is approaching the bottom of value at $33.39. For the rally to continue EEM needs to close above $33.39 for confirmation. Note EEM has also recently has an MACD crossover indicating a trend change.
SPY vs EEM 5 yr chart
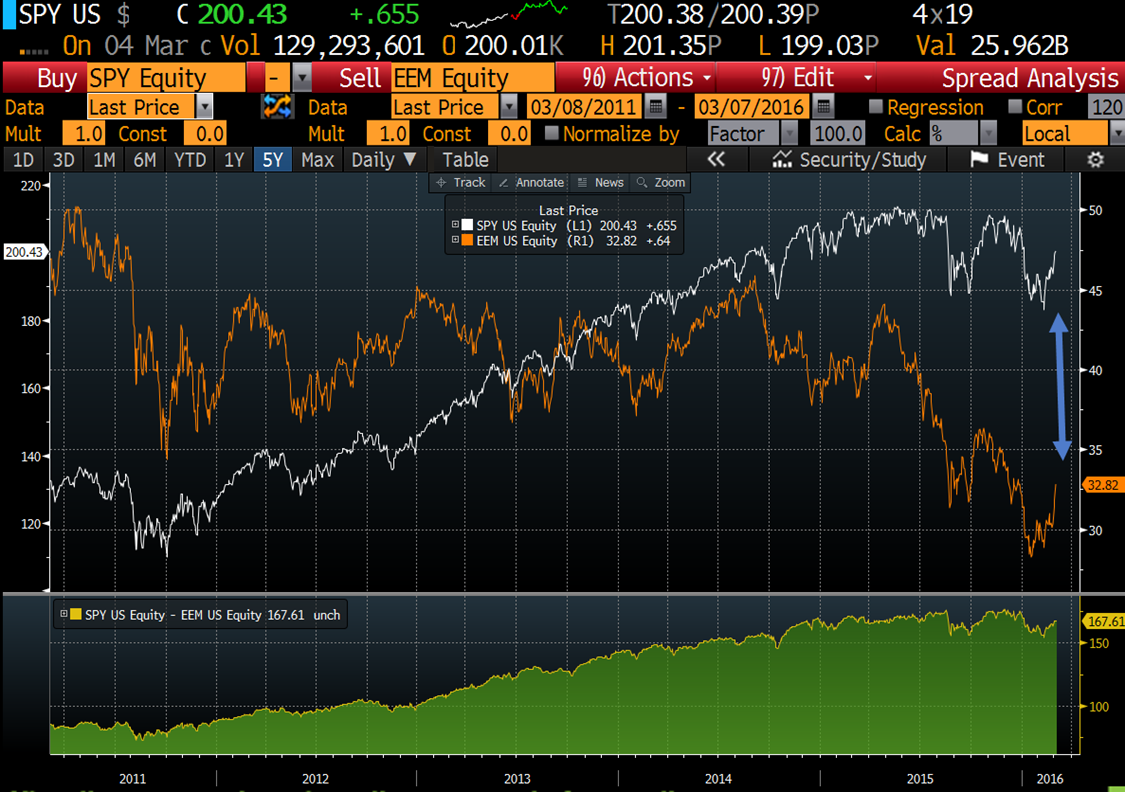
Source: Bloomberg
EEM weekly chart
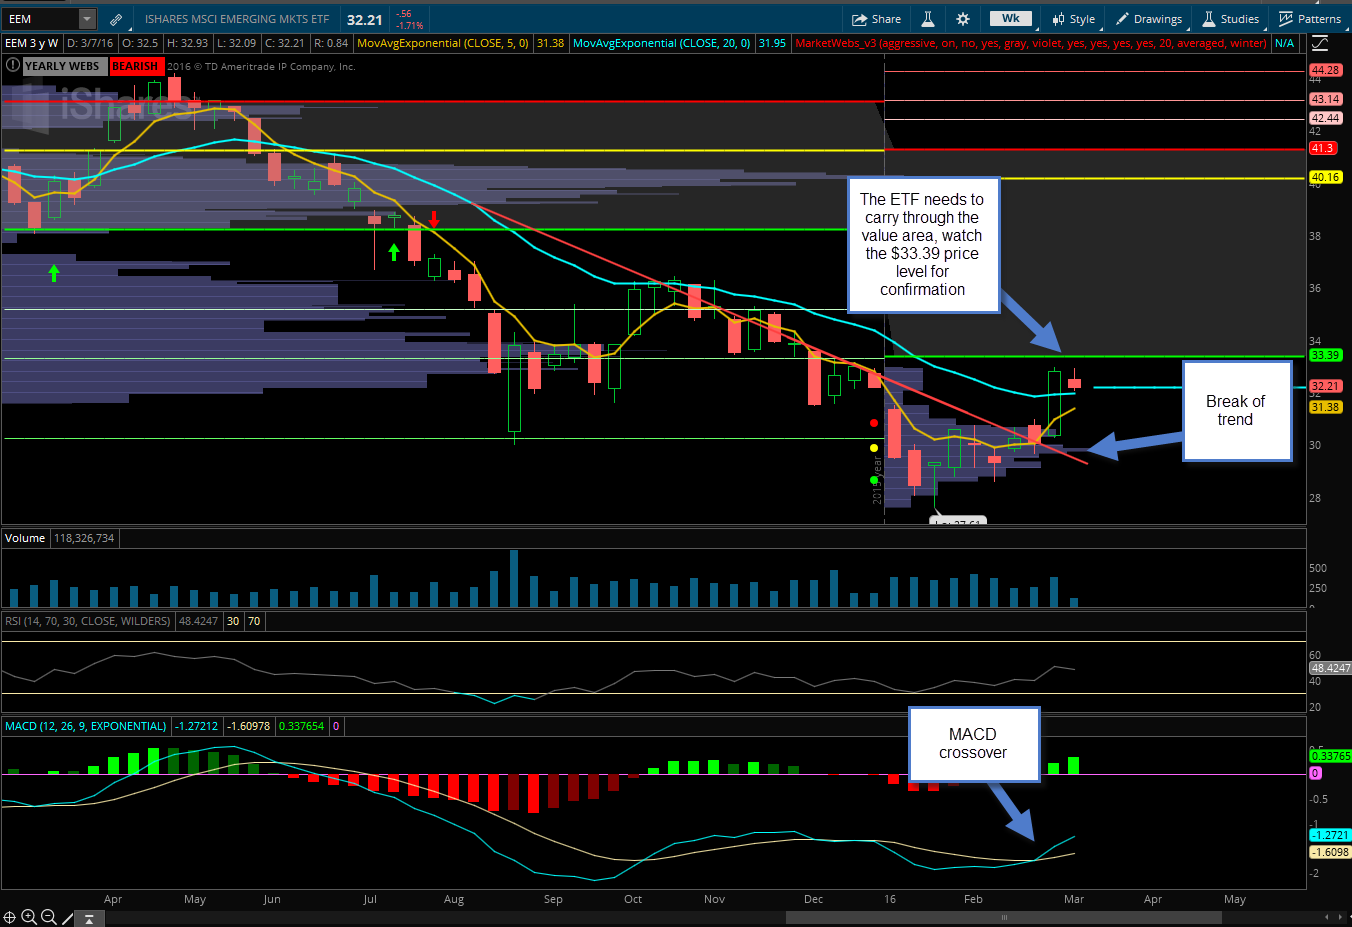
Source: ThinkorSwim
Considering that the 2016 may be a volatile year, we suggest a pair trade to attempt to exploit an EEM / SPY reversion.
The TribecaTradeGroup’s Trade Idea:
– Purchase the EEM Sep 33.5 / 37 call spread @ $1.20 and sell the SPY 215 / 220 calls spread @ $1.15 to take advantage of a possible convergence.

