

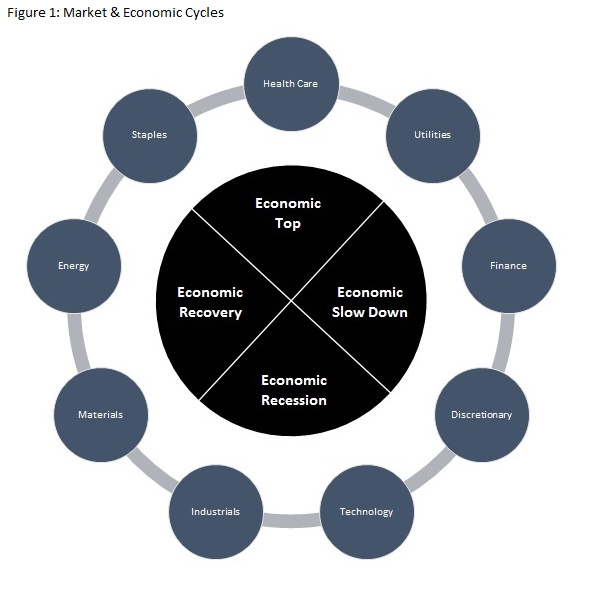
The stock market and the economy move in cycles. The stock market is a leading indicator to future economic trends. Figure 1 explains which S&P 500 sectors typically outperform during various economic cycles. Consumer Staples, Health Care and Utilities are classified as economically defensive sectors and typically outperform when the economy is nearing its peak in the cycle. Money will rotate into the Financial and Consumer Discretionary sector as the economy starts to decelerate. Once the economy falls into a full recession, Technology and Industrials will lead us out the slowdown. When the economy enters its recovery phase, Materials and Energy tend to perform the best.
The approach to take when formulating a sector rotation strategy is investing in different types of sectors within the portfolio that are anticipated to perform the best over the coming twelve to eighteen months. This approach is appropriate for those investors that want to take on a slightly higher level of idiosyncratic risk in hopes for higher returns than just investing in broad based markets. By choosing the appropriate blend of sectors and industries one can attempt to achieve lower systemic risk as well.
Creating a Sector Rotation Model
We took steps to attempt to capitalize on the rotation of performance between sectors. The first step in our strategy was the portfolio structure. We first break the portfolio into quarters. Thus a $100,000 portfolio will invest in increments of $25,000 at the start of each quarter. Each of these allocations are rebalanced on an annual basis creating a “laddered” approach to building and maintaining the allocations. At the start of each quarter a fundamental ranking is done for each sector based upon balance sheet, income statement and cash flow valuations techniques.
For income statement valuation analysis we focus on a particular sectors’ aggregated consensus earnings forecasts. A sectors’ “bottom line” represents the income left after expenses that goes back to its shareholders. Companies within the sector may pay out these profits in the form of dividends or reinvest back into the company by retiring debt to influence its cost of capital, buy shares back to influence corporate value or invest in new business lines that are expected to grow. It’s these profits and the company’s use of proceeds that investors will use to help determine the price they are willing to pay for a specific company and once aggregated up, the sector where it resides. One measure that we use to help determine the value of an investment is the earnings yield. The earnings yield for a sector is defined as the aggregation of the constituent companies expected earnings per share divided by its index price.
E/Y = ((12mf/P)-1)*100
Where:
E/Y = Earnings Yield
12mf = The Aggregated Expected Earnings Per Share Over The Coming Twelve Months
P = Sector Price
Using the earnings yield helps an investor determine an expected return on investment that is utilized in making an investment decision. This is a static number that is difficult to measure across sectors and industries. The variation and volatility of the earnings yield will vary from company to company based on a multitude of factors including but not limited to; a company’s position in its life cycle, growth prospects, type of industry, corporate structure, etc.
One technique that we utilize is a company’s earnings yield relative to its earnings yield profile. Thus comparing its yield to its historical tendency sheds light on its value today. Based on a company’s historical corporate profile, the earnings yield analysis will offer a portrait into the future to where the company’s stock price may be heading.
We also look at the balance sheet to assist in setting an appropriate value for the sector. Theory dictates that a company’s growth in market capitalization should closely resemble its growth on its balance sheet. If one takes the total assets and subtracts the total liability, one will find the owners’ equity in the company. One problem that we find in using the balance sheet approach is the difficulty and lack of data in forecasting what the balance sheet may look like in the years to come but using the trailing twelve month book value per share has worked well.
Similar to the earnings yield, by using the twelve – month trailing book value per share we can create a book value yield and compare this yield historically. When used in conjunction with the earnings yield, book value yield provides more data on which to base an investment thesis. It assists us in determining if the current earnings yield is reflective of the strength of the balance sheet that the company.
BV/Y = ((T12mBV/P)-1)*100
Where:
BV/Y = Book Value Yield
T12mBV = The Trailing Twelve Month Aggregated Book Value
P = Sector Price
The statement of cash flows offers additional information that we incorporate into our modeling approach. By tracking the aggregated twelve month trailing free cash flows for each sector we in turn create a FCF yield for purposes of historical reference.
FCF/Y = ((T12FCF/P)-1)*100
Where:
FCF/Y = Free Cash Flow Yield
T12mFCF = The Trailing Twelve Month Aggregated Free Cash Flow
P = Sector Price
Putting the Valuation Together
Once an analysis is run using the three metrics discussed, we will have three different fair market value figures for a specific sector. This begs to question which fair value target to use for the specific sector. The solution comes in the form correlation. We utilize a valuation measure that lends to a more dynamic approach to sector fundamentals and is more versatile with cross comparisons than a simple static P/E or book value approach.
Each metric is tested for historical accuracy in predicting the future movement of the stock price. Once the correlation analysis is conducted for each metric, we use a weighted average in combining price targets. Thus, the metric with the strongest historical track record in determining future stock prices gets the greatest weighting in the final valuation analysis.
FMV = (E/YV*E/YW) + (BV/Y*BV/YW) + (FCF/Y*FCF/YW)
Where:
FMV = Fair Market Value of a Specific Sector
E/YV = Fair Market Value using the Earnings Yield Metric
E/YW = the Predictability Correlation Weighting Assigned to the Earnings Yield Metric
BV/Y = Fair Market Value using the Balance Sheet Valuation Metric
BV/YW = the Predictability Correlation Weighting Assigned to the Balance Sheet Valuation Metric
FCF/Y = Fair Market Value using the Free Cash Flow Valuation Metric
FCF/YW = the Predictability Correlation Weighting Assigned to the Free Cash Flow Valuation Metric
Historical Back-Tested Results
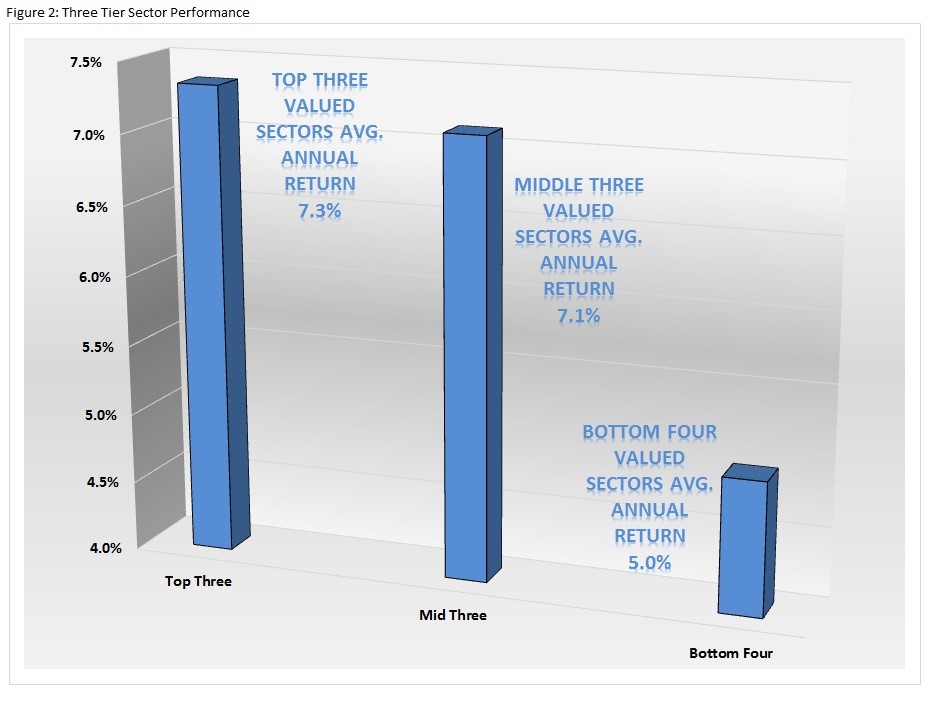
We conducted a study using the returns of the various sectors in the S&P 500 for the past fifteen years. Figure 2 shows that from 2000 through 2015, investing in the strongest top three fundamental ranking sectors has produced the greatest returns than investing in the middle three sectors. The top three handily outperform those sectors that fall in the bottom four.
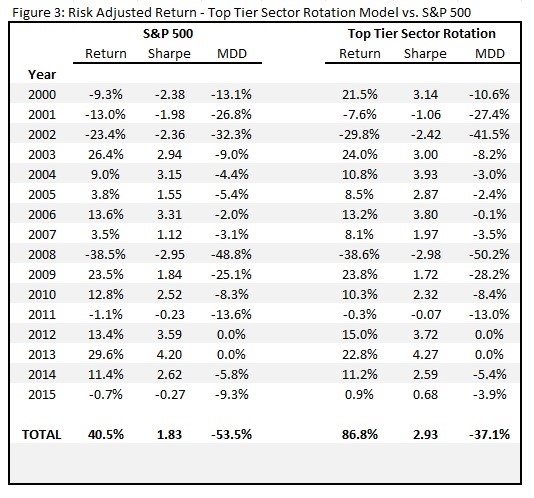
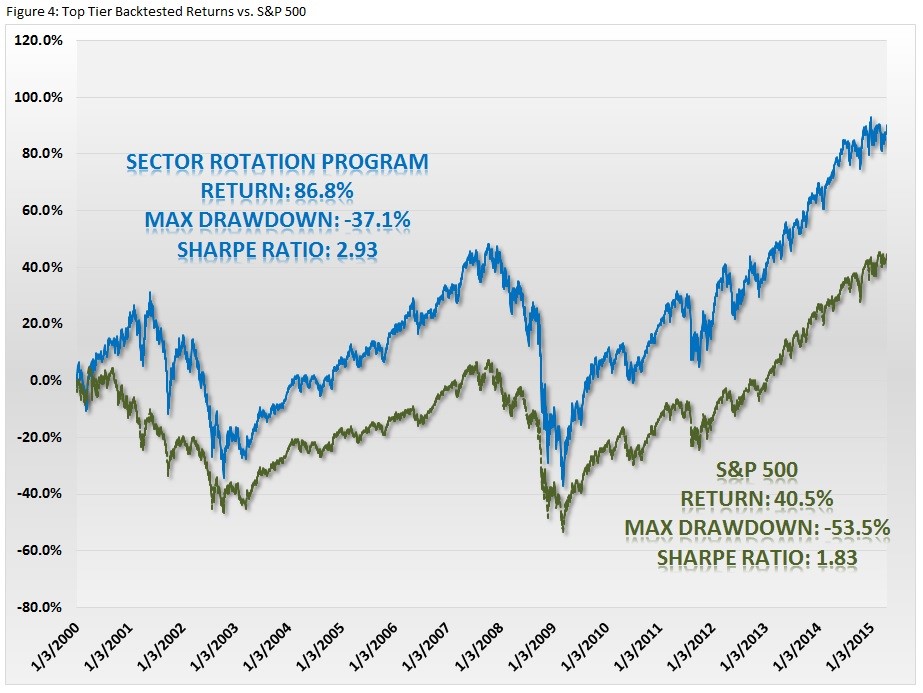
By investing in those top three sectors that offer the greatest upside and rebalancing annually, we are able to produce superior risk adjusted returns than just investing in the S&P 500 index. The time frame analyzed was clearly a volatile and challenging stock market which included the bursting of two bubbles, the dot.com crisis of 2000 and the housing crisis of 2008. Taking a buy and hold approach in the S&P 500 over this time period resulted in a 40.5% return and a Sharpe ratio of 1.83. The maximum drawdown over this period was -53.5%. By investing in those top three sectors that fundamentally offer the greatest upside potential, the portfolio gained 86.8% over the same time period. The Sharpe ratio was a much stronger 2.93 and the maximum drawdown was -37.1%.
Screening Results for March 2016
While we typically run the screen at the start of each new quarter, we ran the model at the beginning of this month for the purposes of sharing with the readers the most up-to-date findings. Here are the S&P 500 sectors ranked in order of best to worst.
1 – Health Care
2 – Financials
3 – Telecommunications
4 – Technology
5 – Consumer Discretionary
6 – Industrials
7 – Materials
8 – Utilities
9 – Consumer Staples
10 – Energy
In our next submission to TraderPlanet we will discuss in greater detail our method of picking companies within the highest ranking sectors using similar quantitative methods.
Thank you for reading.
Joseph S. Kalinowski, CFA
Email: joe@squaredconcept.com
Twitter: @jskalinowski
Facebook: https://www.facebook.com/JoeKalinowskiCFA/

