US equities have been moving in lockstep with the price of oil since the first of the year.
The moves aren’t exact: oil is at the bottom of a long slide, and equities, as measured by the large cap index, the S&P500, are still near the top of an historic Bull run.
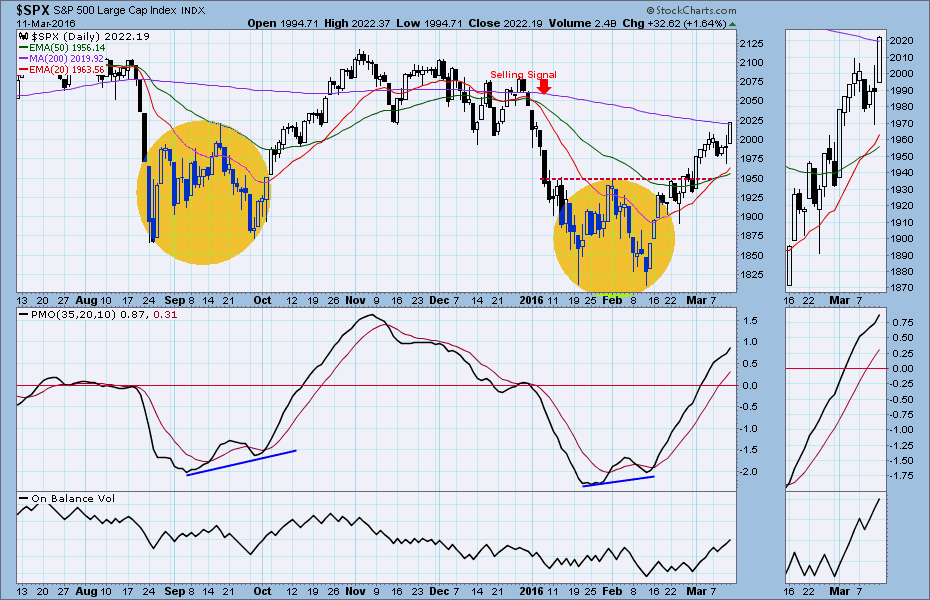
But since the beginning of the year both have formed the same pattern on the charts: a clearly-defined “W” with spike lows that is sometimes the precursor of a continuation move up.
Technical traders, who swear by patterns (and sometimes ignore fundamentals), will be watching for a break-out above the top of the pattern on heavier volume as a signal for a continuation move up.
The problem is that as much as we rely on technical analysis, you can’t ignore fundamentals for these two markets.
Oil, for example, has had a nice run since January 20, in part on the strength of propaganda about a production freeze by Saudi Arabia and Russia. But the “freeze” just holds production at their current levels, which haven’t changed all that much since 2014.
Meanwhile the additional production – the cause of the glut that is decimating oil prices – is coming from the US and Canada, Iraq and now Iran. So excess production will continue to fill every storage facility on the planet and most of the ships at sea.
Absent a sudden increase in demand, the recent increase in oil prices will just make the problem worse, by encouraging producers to pump more; it may be their last chance.
So crude may creep above $40 a barrel, but the good old days won’t return any time soon.
The S&P500 is somewhat similar. The reversal started at the same time, Jan. 20, and has now regained almost all of the loss made in 2016. It closed Friday at 2022.19, up 22 points for the week, and closed above the 50-week moving average and the 200-day moving average, both key medium-term resistance levels. The near-term outlook is bullish.
But we are still skeptical. It looks good. But we aren’t going to proclaim the return of the Bull just yet. There is still lots that can go wrong.
This week
This week will test your nerves. It is quad witching week, when the futures and options all expire, usually a bullish event. Plus the Fed has the FOMC meeting to report on Wednesday, jobless claims on Thursday and three Fed governors out enlightening the masses, each in their own way, on Friday. Expect excitement.
Thursday’s low in the SPX (1969) could be the level acting as support for this week. 1967-66 will be first major short-term support. As long as the index stays above this zone, the short-term uptrend remains intact.
The major resistance areas above the 200-day simple moving average line are lying around 2050 and 2085. But the Bulls will need to fight through the 2025 level before getting to those upside resistance lines. There are open gaps to fill at 2043.94 and 2063.36.
Today
The S&P500 mini-futures, our preferred short-term trading vehicle, has rolled over to the June contract, ESM6. It closed Friday at 2010.75
The minis were bullish on Friday with a gap up at the open and a close above the gap. Total volume was below average however.
Today the 200-day moving average line is lying at 2014.25, and is the first major resistance. That line will attract a lot of attention from traders. A move past it, continuing above 2023.50, will convince buyers that the ES intends to go higher up to the 2050-75 zone, if not now then later.
A failure to break above it will lead to a minor pullback to retest last Friday’s low (1895.75) or lower to fill the 1989.75 gap. But “buy the dip” at support levels will continue to be a popular trading strategy.
Today is a holiday in Newfoundland. Erin go braugh.
Major support levels: 1968.75-66, 1950-45, 1923.50-21, 1907.50-03.75, 1893-92
Major resistance levels: 2014.50-16.75, 2023.50-21.75, 2031.50-35.50, 2047-53.25
Get the Naturus.com Market Preview for the S&P500 and Gold futures delivered to your mailbox FREE every weekend. Click here:
Chart: SPX Daily chart to March 11. 2016