
There is so much disinformation about the gold market lately that it is hard to get a good handle on the facts. I’ve seen so many statistics that are so out of line its ridiculous. That not withstanding, there does now seem to be some evidence that a significant bottom has been put in since the price top in September 2011.
In the bigger picture, many oversold commodities have rallied nicely since the December lows. The CRB Commodity Index has made a nice move higher over the last couple of months.
Crude oil has not rallied as significantly as some of the others. Still, it looks like price is no longer “on the ropes”. So is this simply a dead cat bounce of an extremely oversold over market? There are several technical indicators that suggest it is genuine. There are others that have still not confirmed.
First, on the weekly chart, you can see that the Average Directional Index (ADX: my favorite indicator) has risen sharply since the end of January. The ADX is an indicator to suggest if a market is trending or not. A sharp rise, as in the chart below (especially from a reading from 15 or below), tends to indicate that the market has entered a trending mode. The interesting thing about the ADX on the weekly gold chart is that it is the largest and fastest rise for an upward price move since the top in 2011.
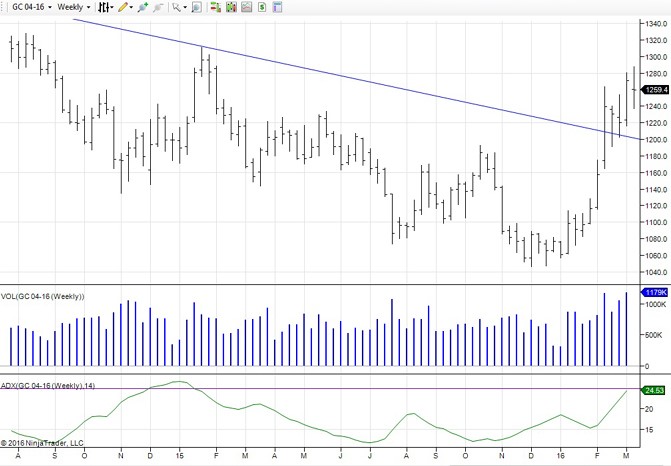
The other thing about this chart that is bullish is that volume has expanded on a rising price. Also open interest has grown nicely, indicating new longs continue to enter the market.
If you switch to the monthly chart you can see that price has had a nice trend-line breakout to the upside. Combine that with good volume and it is a strong clue that this price move is for real.
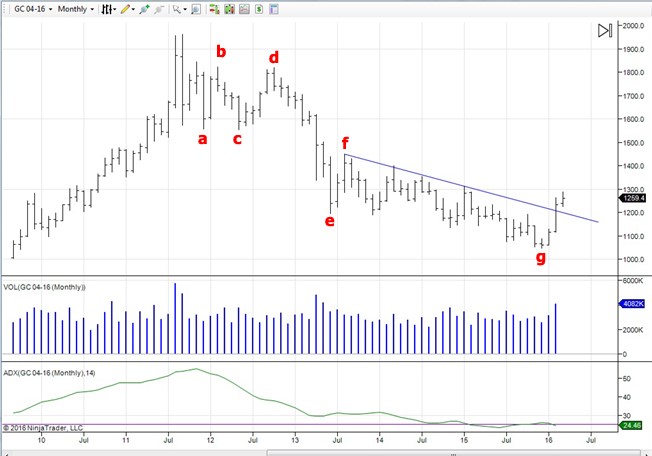
However, there are some events I would like to see happen to give me a signal of an all clear in calling the bottom. First is that the monthly ADX has not yet turned up. The second is the size of the rally compared to other rallies since the top in 2011. Here are the numbers, low to high, dates, and size:
a-b : 12/11 – 02/12 : $266.50
c-d : 05/12 -10/12 : $263.10
e-f : 06/13 – 08/13 : $235.80
Now consider the recent low at $1046.60 in December 2015. Individually add the size of each previous rally. For example, the June 2013 move ($235.80) added to the December low of $1046.60 gives $1282.40. That’s pretty close to the recent high of $1287.80. Its positive that price got slightly above that, but not convincing. However add to the recent low the rallies a-b and c-d and you get $1313.10 and $1309.70 respectfully. The price of gold has not been able to move above that yet. To give the all clear signal, price needs to cross those two levels ( if it does the monthly ADX will probably turn up as well).
Short term the market is overbought and daily momentum is waning. A correction should not surprise. The critical factor will be to see if the channel line on the monthly chart at $1,200 can hold. If it does it would add more support to the idea that a major low is in.
TO RECEIVE MORE ANALYSIS, VISIT PAUL’S website

