

We chart the U.S. Dollar Index because it gives insights about turning points in other paired currencies as well as commodities. The expected rally that we described for the Dollar in our post two weeks ago implies a symmetrical decline in the currency that has the strongest inverse relationship to the Dollar – the Euro. Our long-term Elliott wave chart for Euro futures (EUR/USD) shows how that decline might progress.
While the Dollar is moving up from its 2014 interim low in an impulsive (five-wave) structure, the Euro is moving downward in a similar five-wave pattern. Although the bigger-picture Dollar and the Euro patterns are not symmetrical, the waves that started in 2014 appear to be.
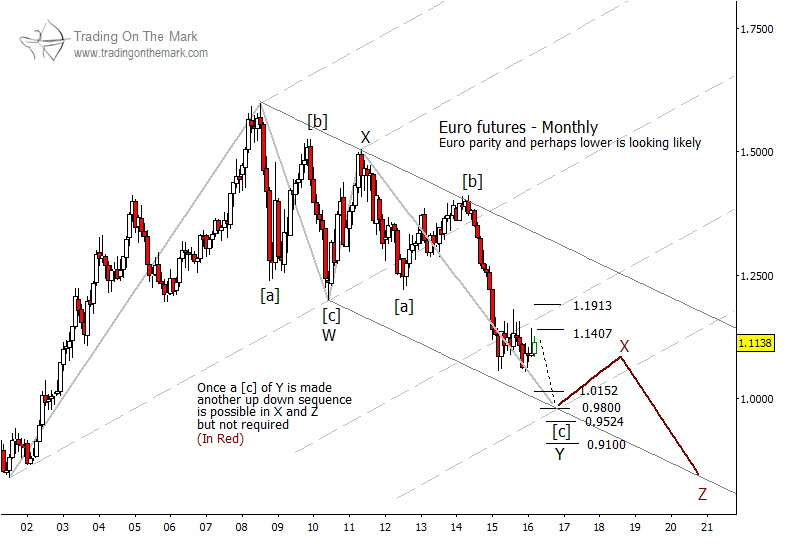
Since we believe the Dollar has already begun the final stage of its upward impulse – small wave (v) – traders might begin looking for short entries with Euro futures and related issues. The two resistance levels at 1.1407 and 1.1913 offer possible “backstops” for short positions.
Support levels and targets for downward wave (v) of [c] of ‘Y’ may include 1.0152, 0.9800, 0.9524 and 0.9100. The lower parallel also could provide support to create the next bounce sometime later in 2016 or in 2017.
On a larger scale, we believe the Euro is tracing a complex corrective pattern that is composed of a series of three-wave moves. When there are just two corrective structures linked together, the labeling follows the format W-X-Y. When there are three such structures, the labeling is W-X-Y-X-Z. Since we believe it is somewhat unlikely that the Euro is moving toward a truly long-term low this year, we are projecting the correction to include three segments instead of just two.
Our newsletter this month discusses the big picture in interest rates and treasuries. Click here to request your copy!

