The US large cap index, the S&P 500 ($SPX) closed at 2049.58 on Friday, up 27.39 points for a net weekly gain of 1.35%.
Theindex recovered all the losses made earlier this year, and closed above the yearly open with a small gain on Friday. The current price action suggests that the 1810 area could be the low for this year. So what happens next?
The general outlook is positive. It looks like we are going to get out of the first quarter pretty much where we started, if we can get past the Easter weekend unscathed.
When you remember that this is the best quarter of the year for stocks, that doesn’t sound like much of a win.
But when you remember where we were at the end of January, it looks like a very narrow escape … but an escape nonetheless.
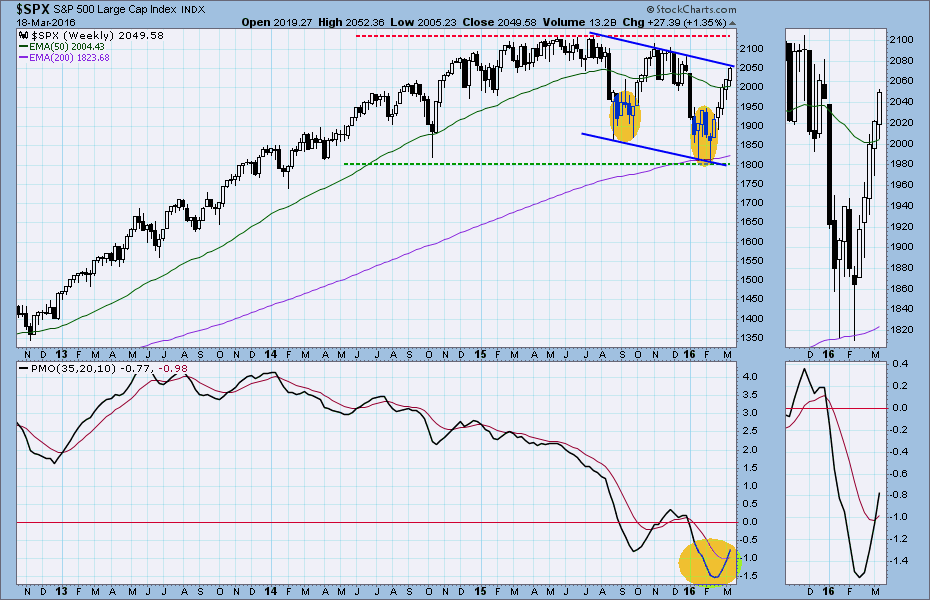
The Index closed above the 50-week moving average line Friday which is bullish for the intermediate and long term, and the weekly momentum indicator squeezed out an intermediate-term buy signal.
But don’t bust out the bubbly yet. The market came through the FOMC announcement and some bizarre statements from the Fed, and slipped past the normal turmoil of quad witching week in a state of near tranquility.
After that performance – not so much great gains as avoiding great losses – there is bound to be a little lull after advancing steadily for five weeks.
Earning season will start soon, and that will carry a double whammy: the reports are more likely to be bad than good, and during earnings season companies have to suspend stock buybacks.
Since one of the major props beneath the market has been company stock purchases, even a brief halt is likely to generate a retracement of some kind.
If you look at the weekly price chart (below) you can see that the price is bumping up against the top boundary of a substantial down channel. This will become a make-or-break area.
If the index can get past it, the upside target becomes last year’s high around 2135, and maybe higher.
If the market stalls in the 2085-93 range, we will be expecting a retracement to the 50- or 200-week moving average.
This week
Friday the S&P500 closed under the 2050 level, but remained above the 200-day simple moving average line, which gives a bullish outlook for the short-term, and there is an intermediate-term buy signal that could hold index up this week.
The index has already broken out from the neckline of a double bottom pattern and is continuing higher. The full target for that breakout will be around 2085.25, a significant price point.
This week we may see some weakness, but the weakness shouldn’t damage the short-term uptrend, as long as the 2000 level holds the index up this week.
Today
The S&P500 mini-futures (ES), which is our principal short-term trading vehicle, gapped up at the open Friday and managed to hold the gap through the day, a bullish sign. However the volume was a little lower than the previous day.
2037.50 was this year’s opening price, and 2037.50 was Friday’s close. After almost three months of gyrating back and forth, the total progress is… zero. You can understand why we prefer to trade the zigs and zags.
Today the 200-day moving average line at 2012 will be the first short-term support. On the upside, 2043.50-2046.50 will be a breakout zone for any upside move.
A move above that area will persuade buyers that the downtrend is broken and a momentum breakout move could push the price up to 2050-75 to test last December’s high.
A failure to break above it will lead to a minor pullback to retest last Friday’s low 2033-2027 or lower to 2021-23.50. But “buy the dip” at the 200-day moving average line will continue to be a popular trade.
Major support levels: 2023.50-21.75, 2014.50-16.75,1968.75-66.00, 1950-45, 1923.50-21.00
Major resistance levels: 2058.50-62.75, 2068.50-72.75, 2084-85.50
Visit www.naturus.com to see Nat’s full outlook for the week ahead, free of charge.
Chart: SPX Weekly chart to March 18, 2016