A month ago I wrote an article for Trader Planet on the bullish “morning star” pattern found on the daily chart of the main financial ETF (XLF). A month ago, all I could say with any conviction was that the candle pattern boded well for the market as a whole IF the XLF could close above a technical “line the sand” at $21.50.
Sure enough, that watershed event happened on March 1st and the market then ignited into the rocket rally we have experienced for the subsequent two and a half weeks.
All is not well with the financials, by any means. As a group they are still struggling to recover from their misfeasance before, during and after the Great Recession. As a group they are among the most mistrusted companies in America (there’s a list for that.)
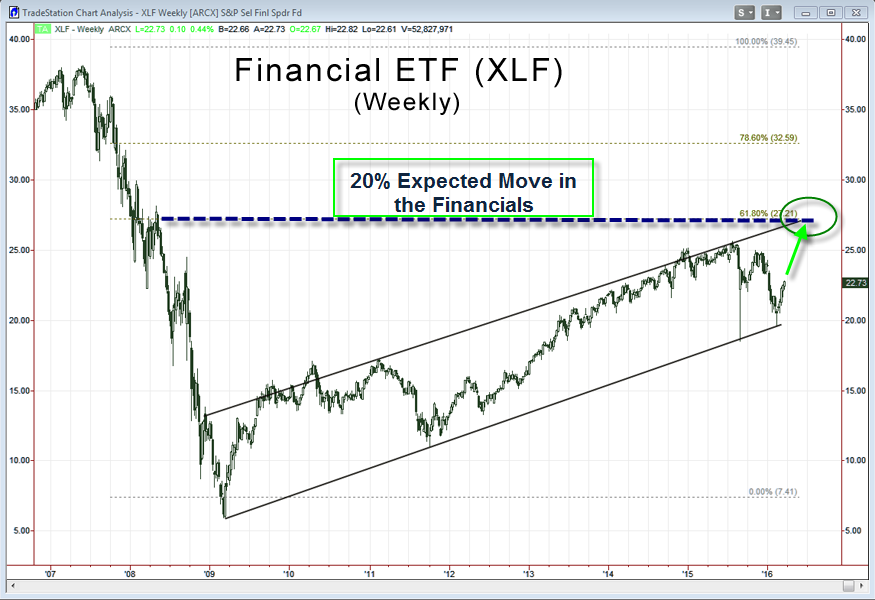
In technical terms, the bounce in this sector has not yet achieved the standard 61.8% retracement one would expect, but that level is on the horizon (see accompanying chart.)
I was a market pundit for 10 years and during that time I learned a few things about market timing. Back then it wasn’t all that difficult because Mom and Pop investor were still very nervous from the bear market and their mood swings were reliable contrary indicators. Honestly, if the AAII % bears was > 60, one should buy with both hands.
Today, however, it’s a little different. The sentiment tables have turned. Today, the professionals are bearish and the AAII crowd is entirely sanguine (26% bears!) Personally, I’m looking for the pros to wake up and play catch up. And I would not be at all surprised to see the financial ETF rally 20%… taking the rest of the market along for the ride.
www.daytradingpsychology.com (Peak performance coaching for private traders)
www.trader-analytics.com (Services for traders at RIAs, banks and hedge funds)