

Oil futures declined off of their 3.5 month highs on Friday. The main reason for the decline was the U.S. rig count rose for the first time in 4 months. Despite the loses on Friday, oil futures traded up 2.44% for $1.27 for the fifth straight weekly rise. Analysts have warned however that the market conditions remain weak due to the ongoing supply glut. Stockpiles are over 520 million barrels which is an all-time high.
Monthly Chart
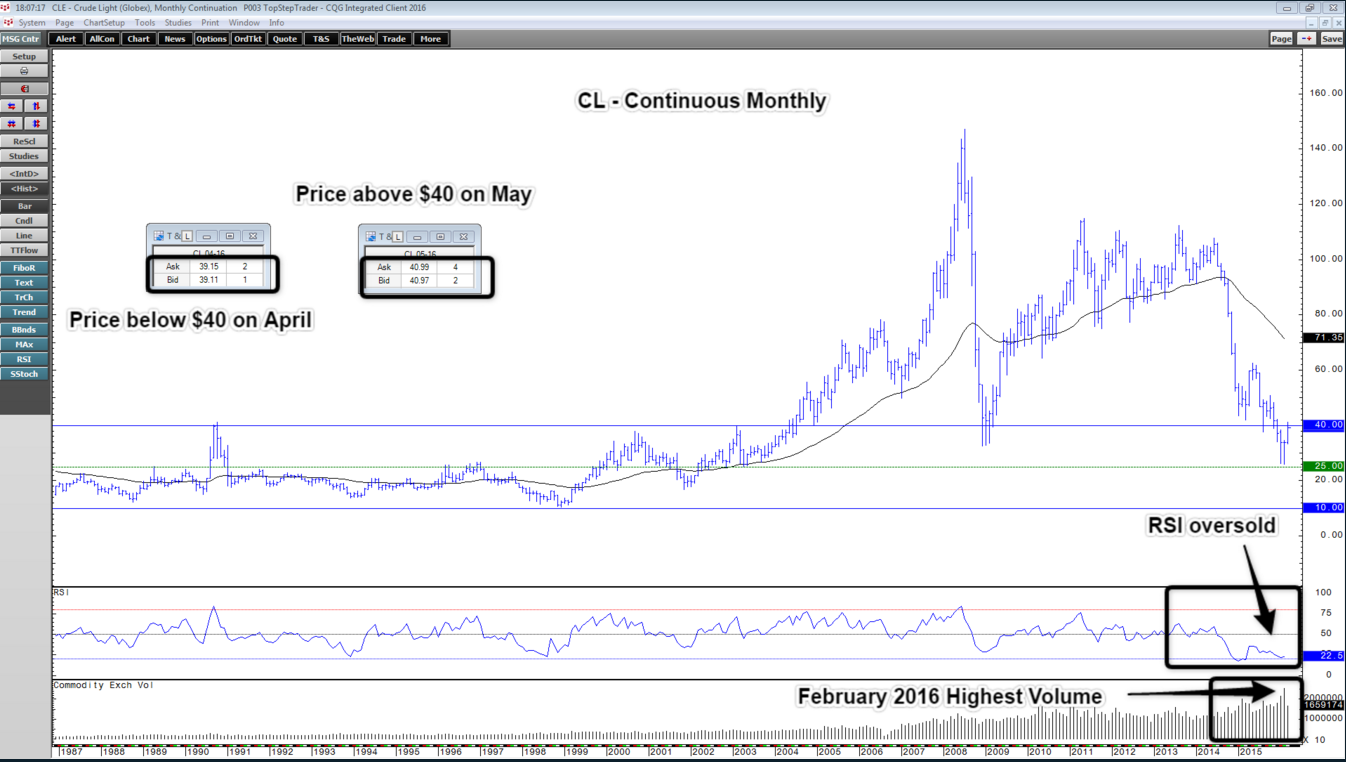
Oil continues to flirt with the $40 per barrel price which has been the “lid” for the better part of the last 30 years. At present we are trading a record number of months (18 total) below the 200 period SMA. We have some indication that we could rally based upon the fact that we had the highest volume in February 2016 as we climaxed at the double bottom low. Couple that with the fact that we were oversold on the RSI and we may have put in a near term bottom. However, if this is the near term bottom, we are a long way away from the 200 SMA, which indicates the overall consensus is Bearish.
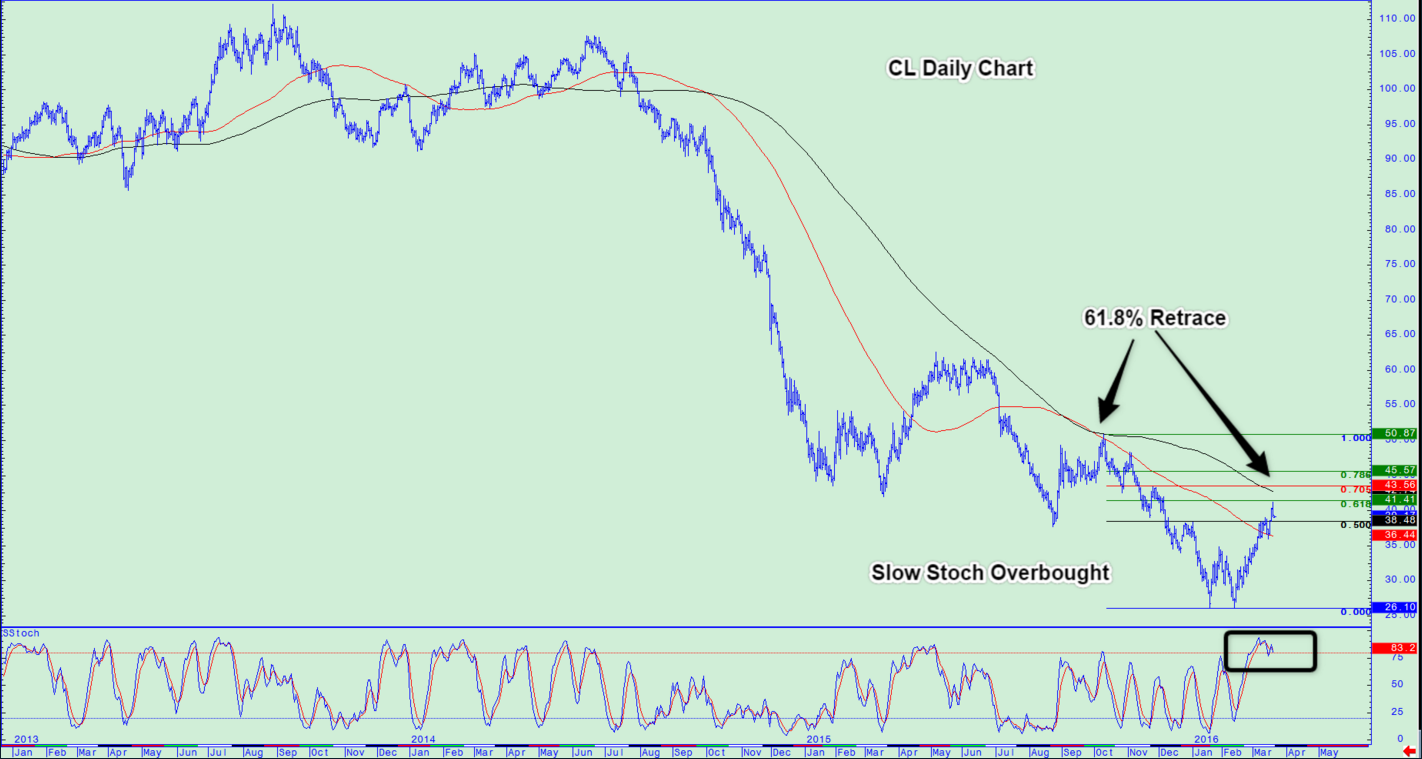
Again, on this chart we are still in a downward trend trading below the 200 SMA. Additionally, we are just completed a retrace to the 61.8% Fib level as well as being overbought on the Slow Stochastic. The daily chart tells us that while we have been making high lowers and higher highs recently, we might simply be in a retracement and looking for another leg down. Overall consensus is Bearish.
60 Minute Chart
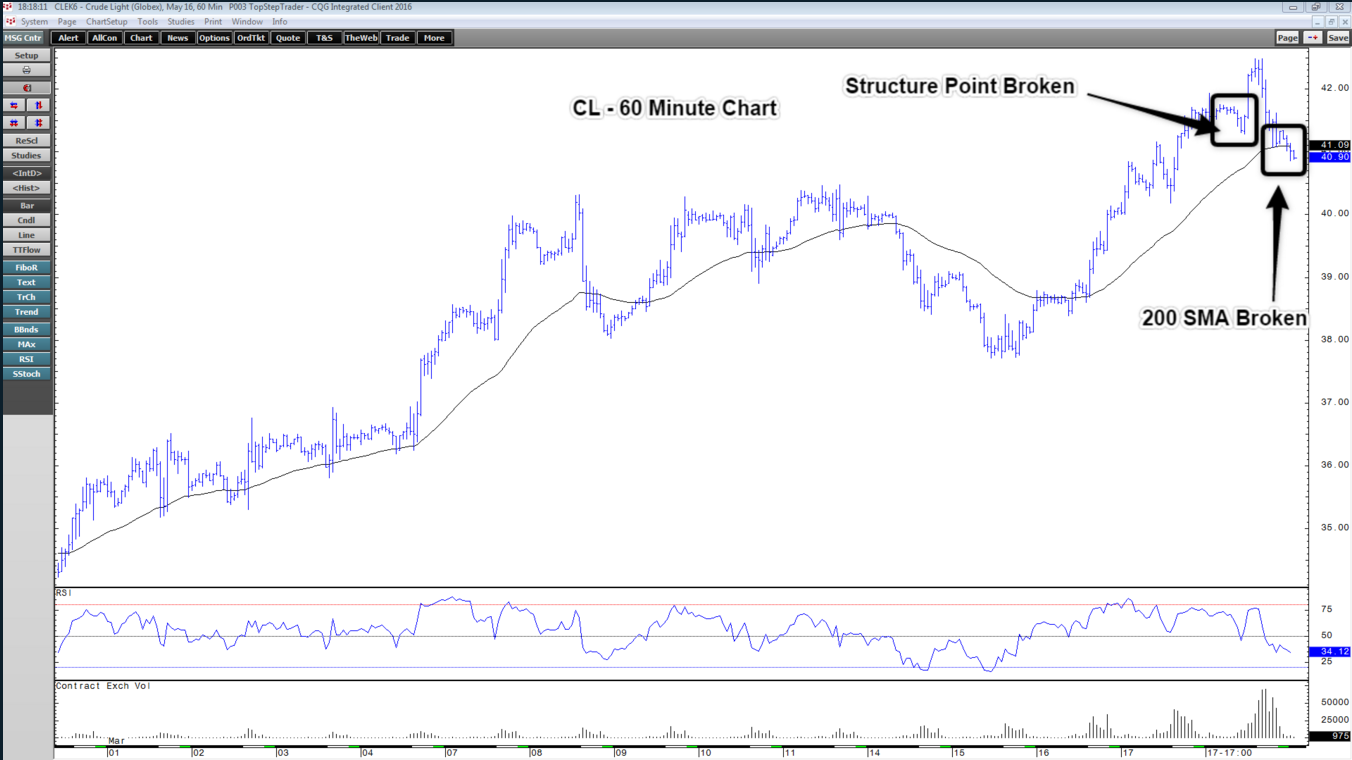
This chart has been in a bullish trend mode since hitting the bottom in Mid-February. Having said that, we are now crossing below the 200 period SMA and could be in a bull trend corrective model. We will be watching this chart closely for more “tells” in the coming week. Overall consensus is Bull Trend Correction.
Weekly Price Targets
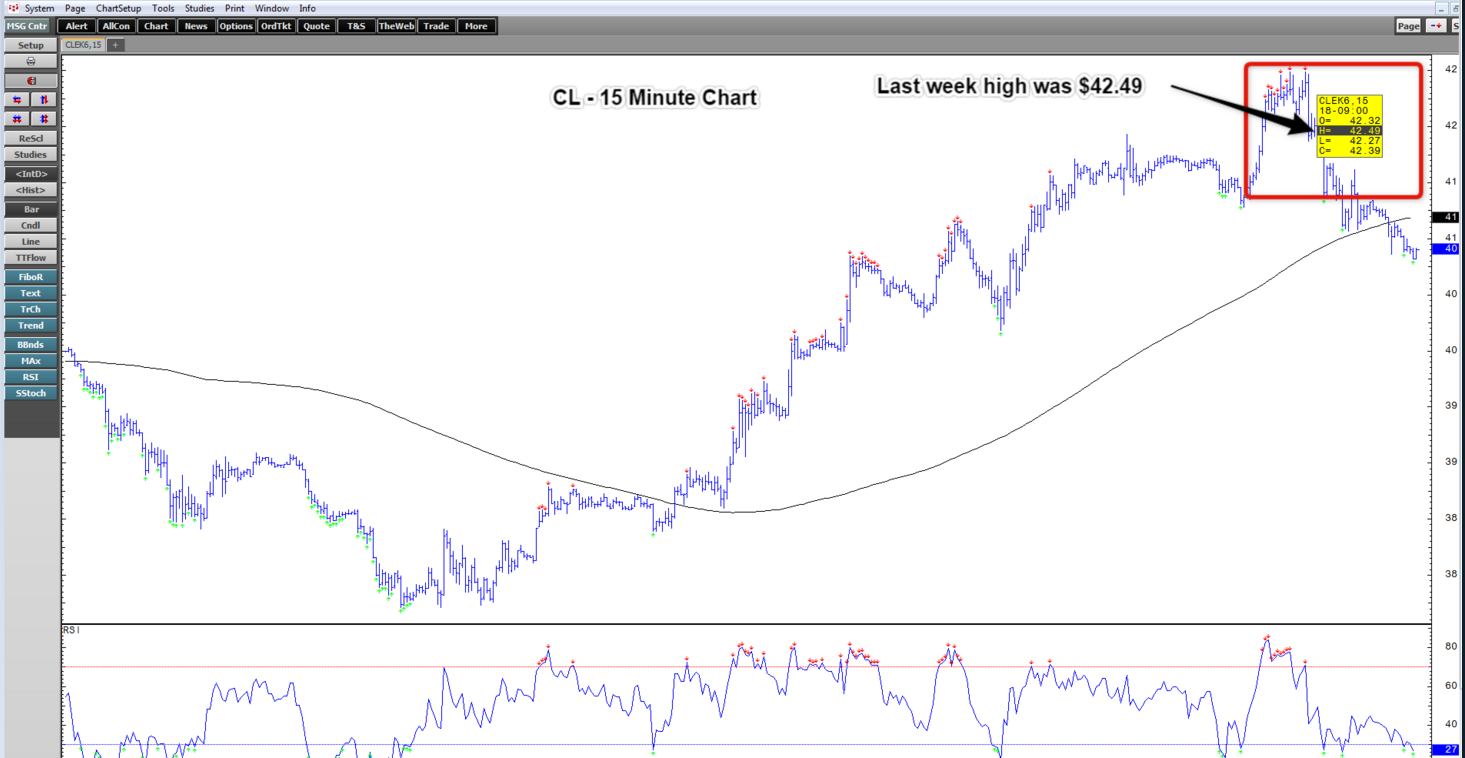
Last week we called for a short at the 42.35 – 42.55 price level. As you can see from the chart below we hit a weekly high of $42.49 before the market began its move to the downside on Friday. You can read more about last week’s analysis by CLICKING HERE.
These are price points on the chart where I would be interested in making a trading decision.
Zones of Interest Above the Market
43.85 – 44.05
45.25 – 45.45
46.72 – 48.09
Zones of Interest Below the Market
39.40 – 39.20
37.80 – 38.00
37.10 – 36.90

