

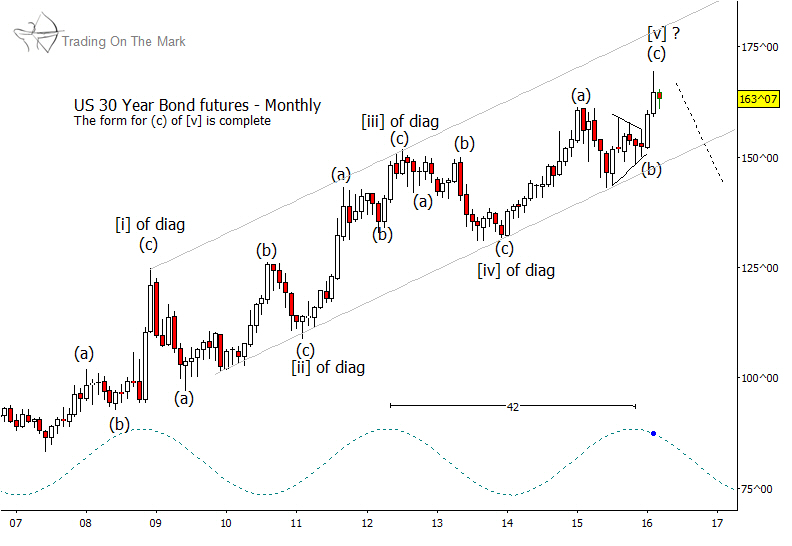
Even as the Fed is signaling that there will be two or more increases in the federal funds rate in 2016, we note that the diagonal pattern in treasuries that we have been following for several years appears to be near completion. Readers familiar with Elliott wave theory know that an ending diagonal should consist of five overlapping waves – here labeled as [i]-[ii]-[iii]-[iv]-[v]. Each of those five waves should be composed of three smaller sub-waves – here labeled as (a)-(b)-(c) in each case. On a monthly time frame, the pattern meets the minimum requirements to be finished. It could reach a bit higher, but we do not believe it will.
The dominant 42-month cycle in bond prices lends more evidence that traders should watch for a decline, since we are now entering the cycle’s downward phase.
Hopefully this perspective will be helpful for those looking for trades on time frames applicable to weekly and monthly charts. For traders looking for moves lasting a few days to a few weeks, the Fed’s stated policy of raising interest rates makes it a near certainty that treasury bond prices are due for a reversal of some magnitude relatively soon. In fact, the reversal may already be in. For traders and investors trying to establish positions they can ride for months or years, pattern analysis suggests strongly that bond prices are near a long-term high.
Our March newsletter explores opportunities with the long bond in more detail, with finer targets on lower time frames. It also examines the relationship with yield rates and one of the premier bond ETFs.
Click here to request your copy!

