

The S&P 500 ($SPX), the index of large-cap stocks, closed at 2035.94 on Friday, down 13.64 points for the week, a net loss of less than 1%. It was the first losing week in the last six.
It was also the smallest weekly price range in five months, barely 35 points in the four trading days leading up to the Easter holiday. For a while there we got used to seeing the market move that far in a day.
Despite the general lack of interest, the SPX still managed to make a new high for the week, as it has every week since the second week of February.
It’s not surprising to see the market slip into a consolidation range after the way it has been steaming upward, ever upward for most of the last two months. And Friday’s price action – the market gapped down at the open, but rallied back to fill the gap at the close – would have been encouraging to the Bulls.
So here we are, waiting for the next shoe to drop in a rally that is starting to run into serious resistance, but still keeps chugging along.
We’ve stalled, at least for the moment. Now we’re waiting to see where it is going to go next.
This week
This week we have the end of the quarter and a whole slew of option expirations – four different weekly and monthly options on the index and the futures expire on Wednesday, Thursday and Friday.
We also have no fewer than eight appearances by officials from the Federal Reserve, four of them on Tuesday, including a speech by the Chair.
It was remarks from two Fed speakers last week that knocked the market back and temporarily ended the rally. We have reached the point where jawboning from the Fed is the most important short-term influence on market direction. That’s dangerous.
The downtrend channel on the SPX weekly chart (see below) is still intact because of the pullback last week. There will be an attempt to move past it this week,
If it is successful, the rally may well continue to a new high. If it fails, the SPX could fall below 2000.
The price we are watching in the SPX is 2020. If the index holds above that level, look for a move to last week’s high (2056) or higher to 2060-65. If the index falls below 2020, we expect a re-test of the 2000 support, and possibly a move below it to the 1980 area.
Today
For short-term trading our preferred vehicle is the S&P500 mini-futures, currently the ESM6 contract.
The minis were retreating last week after a couple of Fed presidents suggested a rate hike in April is a possibility, but a bullish move Thursday kept the ES from giving us a sell signal.
The key line for the ES this week is 2037.50, the opening price for the year. Today we could see a continuation of Friday’s late-day rally if the futures remain above 2010, and a sudden burst of enthusiasm might carry it up to 2045.
If 2010 does not hold up, a re-test of the 20-day moving average around 2000 is likely. If it breaks below 2000 expect to see the sellers come swarming in and push the price down below 1978 in a quick move.
Major support levels: 2005.50-07,1980-75, 1968-1972
Major resistance levels: 2047-45.50, 2058.50-62.75, 2068.50-72.75, 2084-85.50
Visit www.naturus.com to see Nat’s full outlook for the week ahead, free of charge.
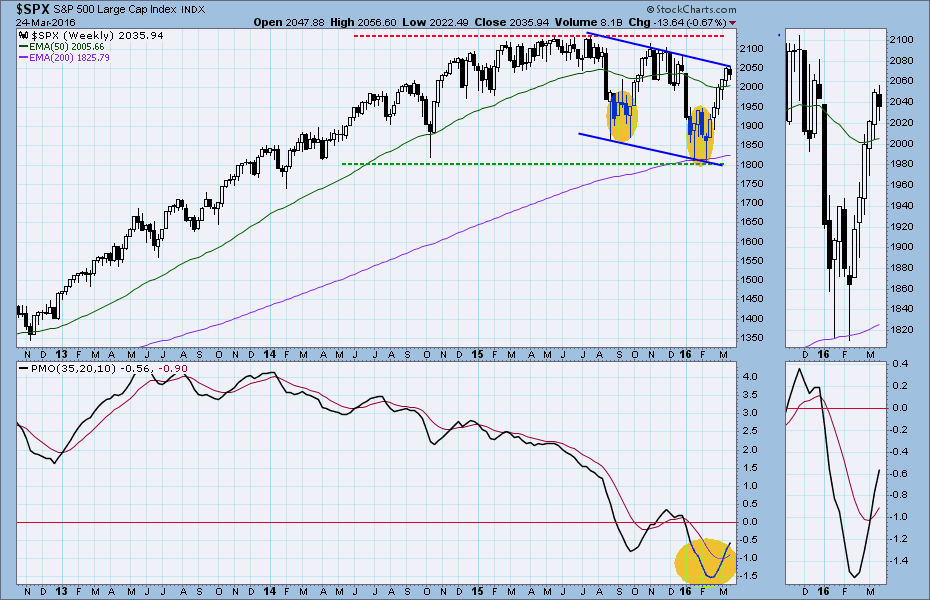
Chart: SPX Weekly chart to March 24, 2016

