We discussed the growing certainty of traders on both sides of the gold market last week here in, “Gold: Tug of War Between Inflation and Deflation.” Last week’s holiday shortened trading schedule once again saw bets continue to grow on both sides of the fence. Fortunately, last Wednesday’s action may have finally given us the first clue that the commercial traders’ hedging of forward production will cap the current rally as some of the late arriving speculators get flushed out below $1,225 per ounce.
We note on the chart below that the net commercial position hasn’t been this bearish since last January but sometimes, the net position doesn’t tell the whole story. We’ve also noted that the stakes on both sides of the fence continue to rise. This is defined by the, “Total Position” category in the Commitment of Traders report. Here we see that the total position (longs + shorts) for commercial traders has reached its highest level since November of 2014. This is indicative in two ways. First of all, subtracting the net position from the total position shows us that commercial traders are net short more than 250,000 contracts. This indicates that while both sides are uncertain due to central banking, political and currency risk, they are collectively 56% more certain that gold will be cheaper in the future than it is, now. Secondly, the total position reaching its largest size nearly a year and a half tells us that commercial traders are VERY interested in gold between $1,225 and $1,300 per ounce.
Typical market action in this scenario is that the price level that brings the players out of the woodwork initially creates a reactionary wall of support or, resistance. Since the market has rallied more than $200 per ounce since the December low, it’s obvious that the resistance will be the reactionary force as forward selling of future production brings the miners to their trading terminals. This bodes poorly for a large speculative position that has reached its most bullish position since February of 2015. That was the LAST time gold traded above $1,300 per ounce. Speculators got bullish and speculators got burned.
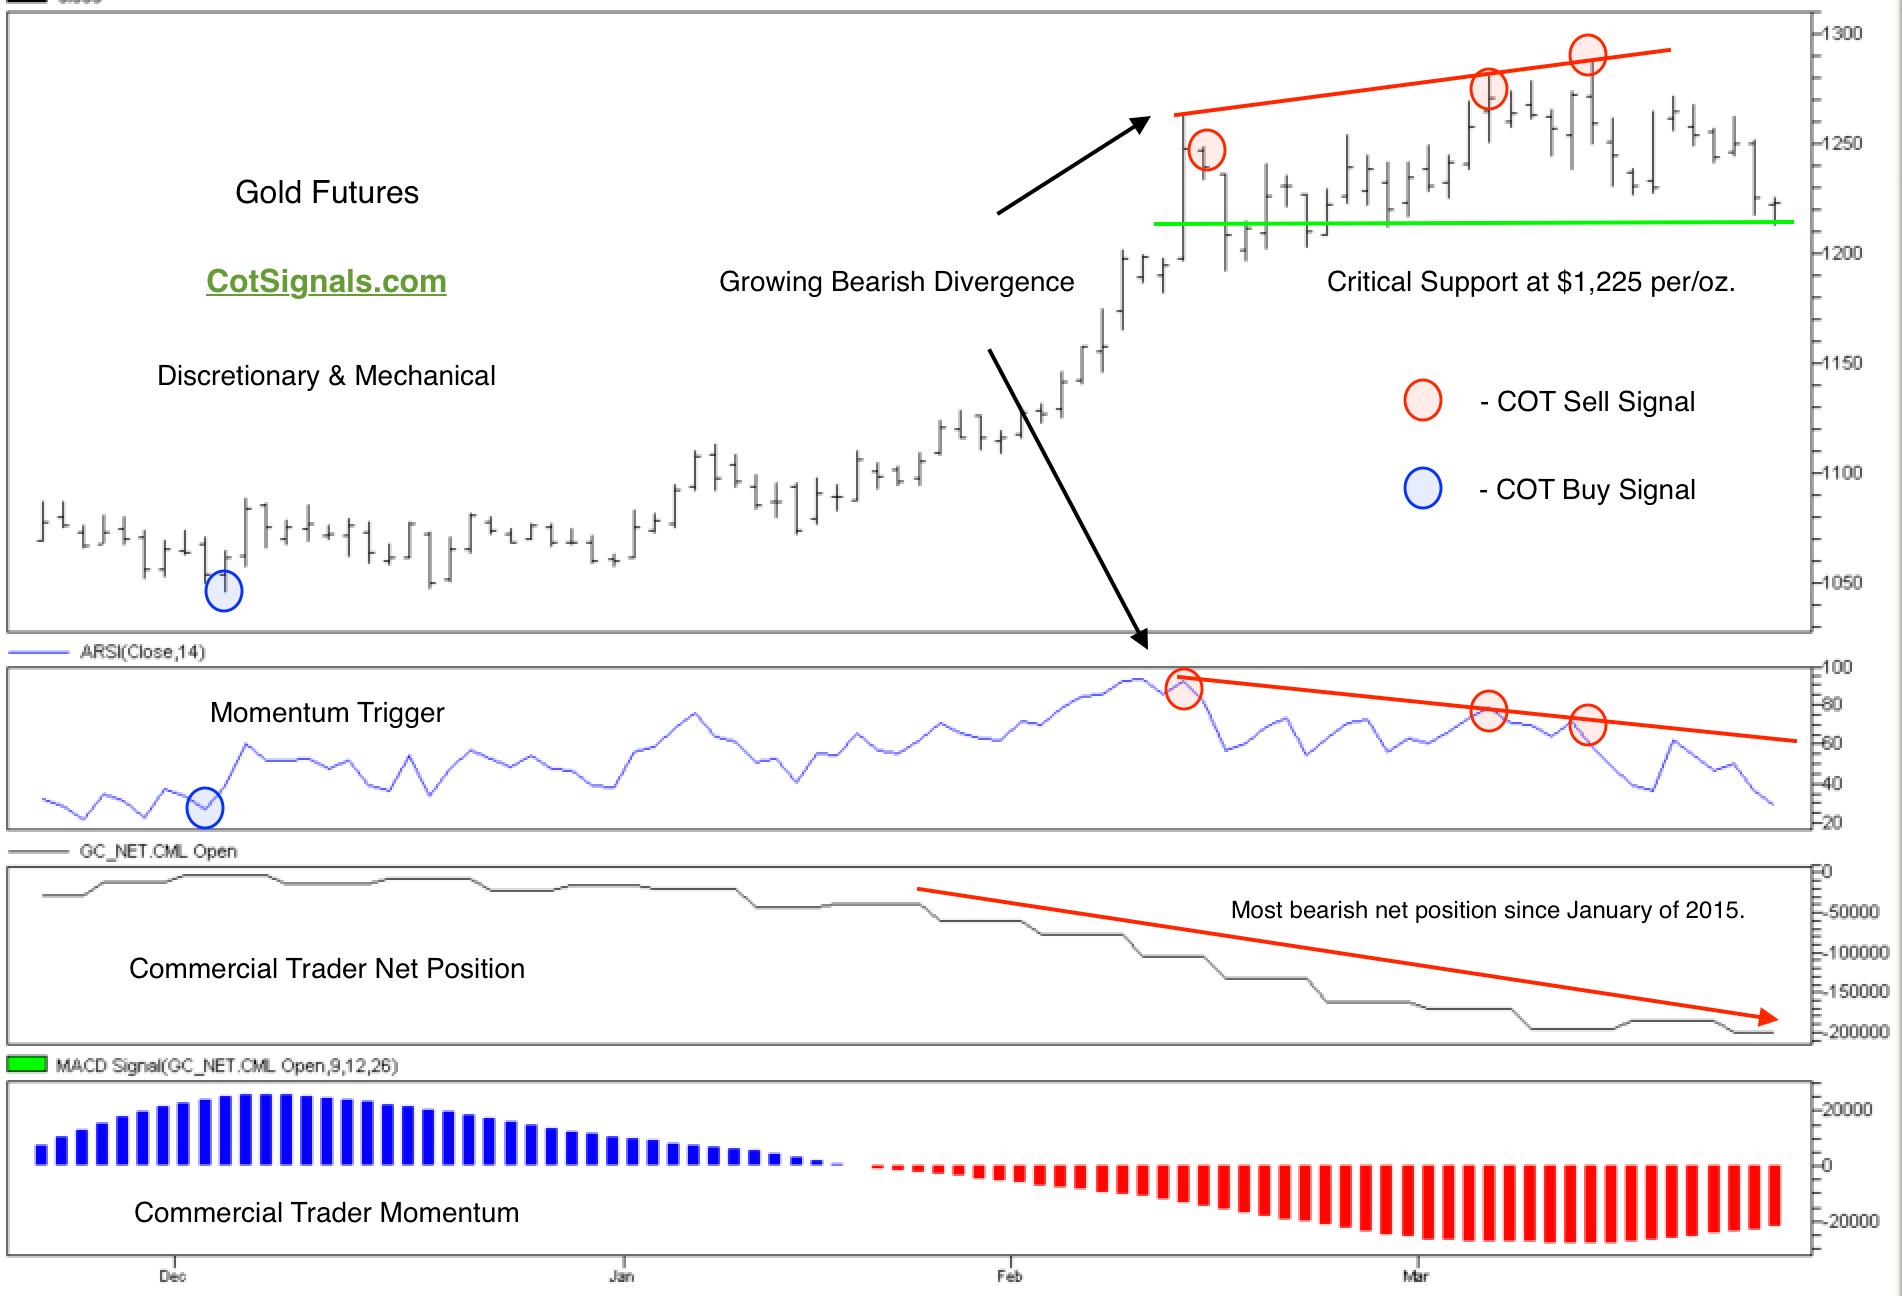
The technical picture in play this week is very clearly illustrated on the included chart. Each of the last three highs in this rally has been met by two things; commercial selling and lower momentum readings. This has created a bearish technical divergence that is supported fundamentally by gold miners selling their forward production at prices they believe are exceptionally overvalued, as shown by the size of their positon. Finally, the technical picture rests on the support that has built up at $1,225 per ounce. A close below Thursday’s low of $1,211.20 would trigger a technical decline back towards the $1,150 area where we would begin to reevaluate our opinion.
Short trades in the metals sector were triggered last week in both our Discretionary and Mechanical nightly services. Please see, CotSignals.com for details.