About a month ago I forecast a target of 17, 271 for the Dow Jones Industrials. At the time there was a fair amount of pessimism in the air from experienced traders who disbelieved the rally.
I noted then that “the rally won’t stop until ‘smart’ traders stop labeling it a bear market rally.” Markets love the fool the most people possible. At the time, there was such a general conviction about the futility of the rally that it appeared to me to be too obvious. I’ve lived through and traded through two previous bear markets and their beginnings were never obvious.
One way to tell whether a rally will persist is if any slight pullback is picked apart and considered a sign of weakness. That was happening all the way up. Similarly, if pullbacks in a downtrend are considered signs of strength, then the downtrend will continue. That’s simply the way market psychology actually operates.
In that article I pointed out that the Dow Jones Industrial Average was above its Volume Profile Point of Control (VPPOC) from 2 years ago and identified the Upper Value Area (UVA) for the Dow (17,271) as the near-term target. Sure enough we got there.
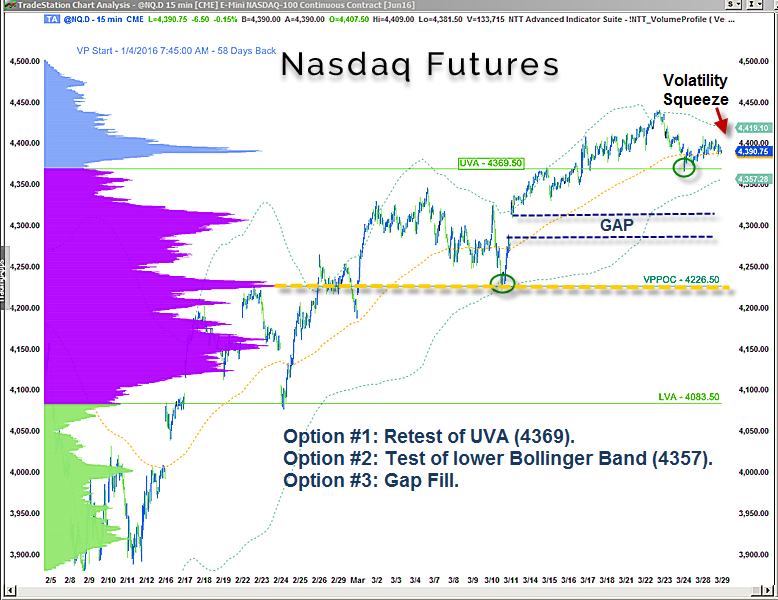
A similar situation existed in the Nasdaq, which is now testing its UVA from above (the light green line on the accompanying chart). By the way, the UVA level is used by institutions and marks one standard deviation above the VPPOC.
The Nasdaq is quieting down. A 200 period Bollinger Band is starting to squeeze. A few options present themselves, listed in the order of increasing severity. 1) A retest of the UVA (4369). 2) A test of the lower Bollinger Band (4357). 3) A gap fill into the 4300 area.
Bottom line, I’m looking for an orderly move lower, which should wash out weak hands and set up another leg higher.
www.daytradingpsychology.com (Coaching for private traders.)
www.trader-analytics.com (Peak performance consulting to RIAs, hedge funds
and banks.)