The price action in the S&P 500 SPDR (SPY) over the last few weeks is a shining example of how valuable volume-at-price information can be. Volume-at-price can inform you of key levels well in advance of prices reaching those levels allowing you, the trader, to anticipate what is likely to happen next.
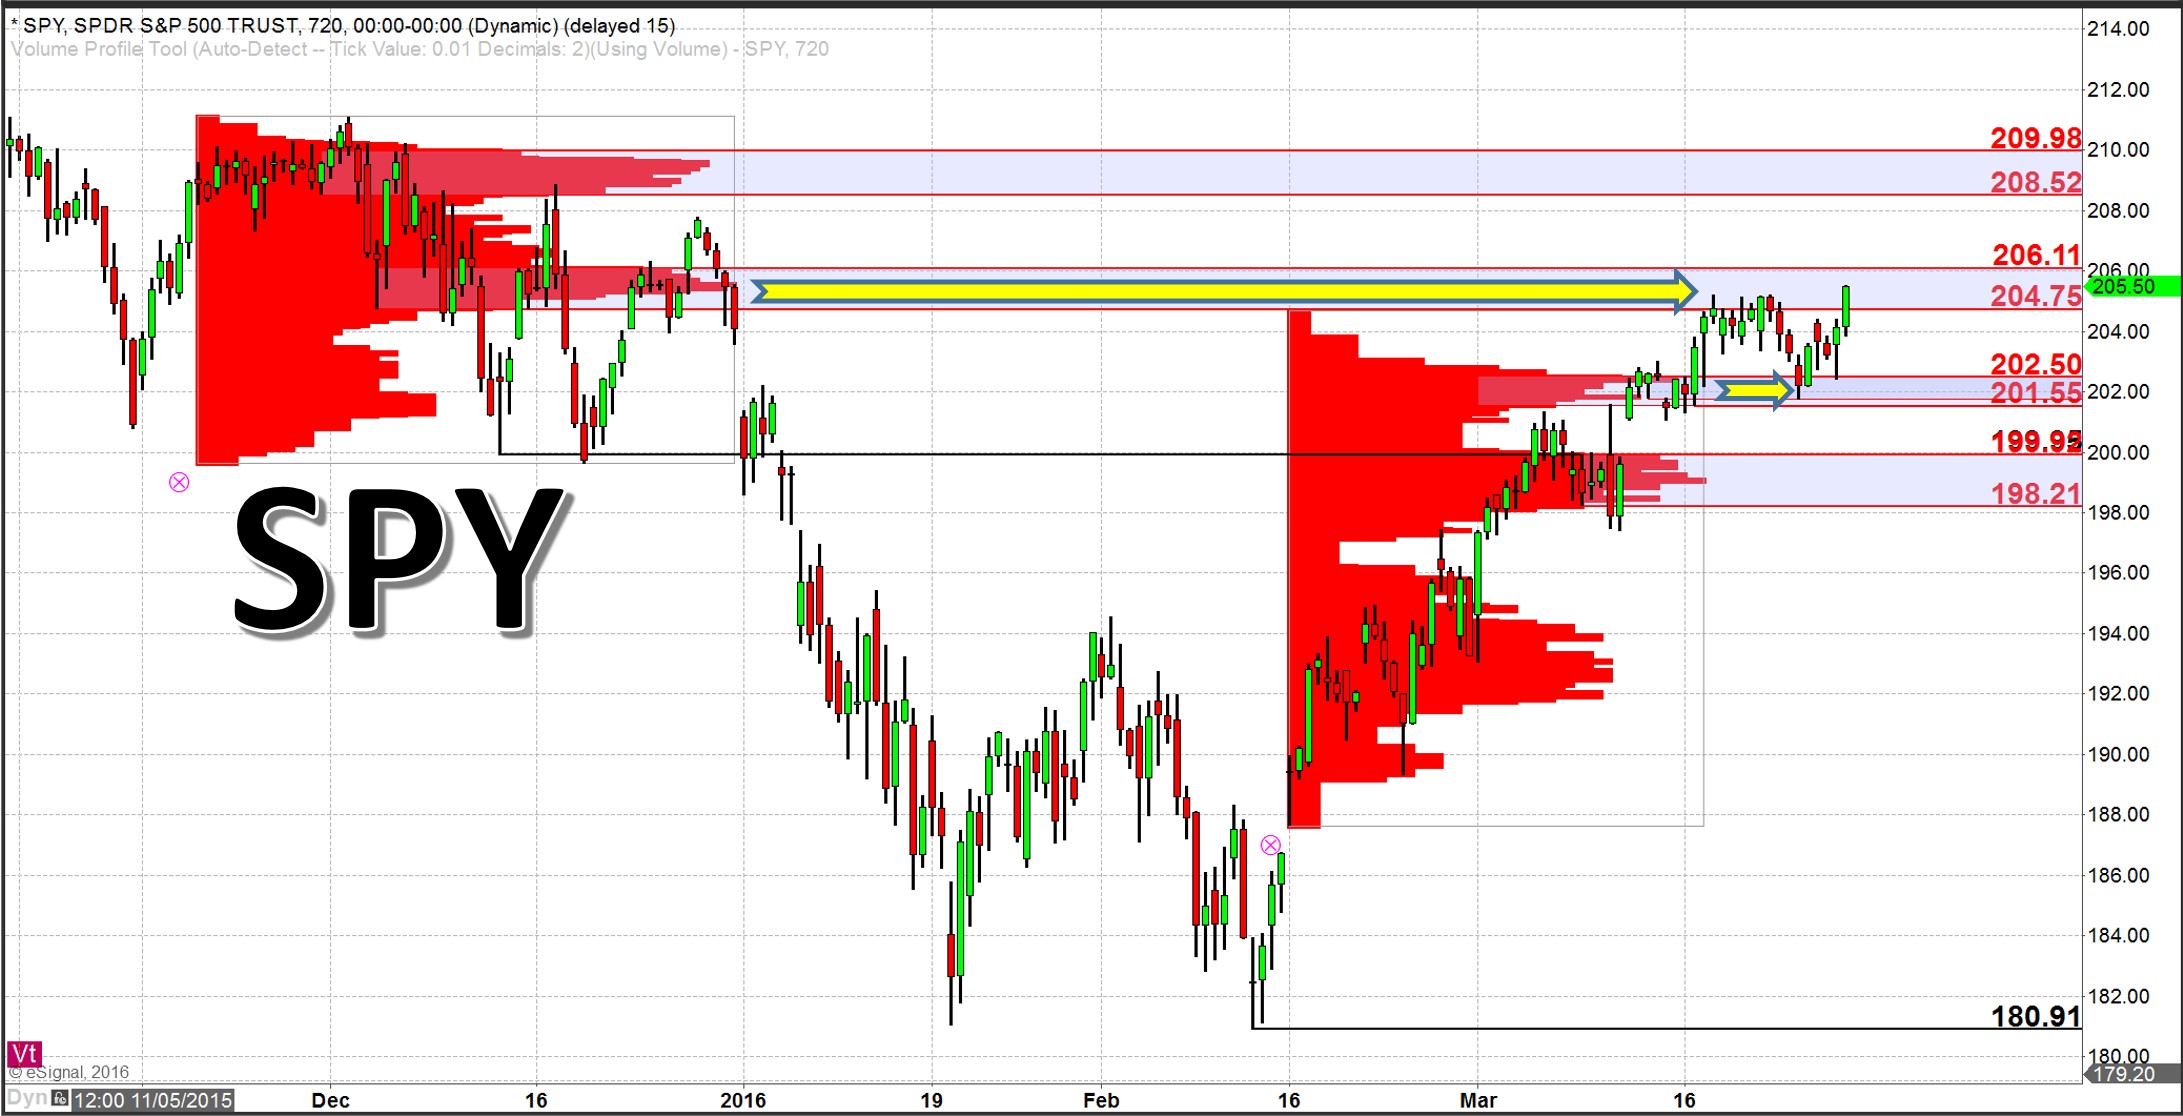
As you can see from the chart below, a couple weeks ago SPY hit resistance at 204.75 – 206.11 and spent 7 sessions testing this zone before succumbing to selling pressure. This was a resistance zone defined by the volume-at-price profile established in December of last year and as such was known far in advance.
Click here to watch a video explaining how to read the stock market using volume at price.
The selling pressure was short-lived however, as SPY only pulled back to the well-defined nearby support zone at 201.55 – 202.50. This nearby support was defined by the volume-at-price profile established only 2 weeks prior but just like the zone of resistance, was known well in advance. From this support, buying pressure reemerged and price was turned back to the upside.
As SPY continues higher, the upper boudary of the resistance zone is at 206.11. On any move above this level, the next upside target / resistance zone would be 208.52 – 209.98.