Although the London FTSE Index appears to have started a declining impulsive structure in 2015, the next few months should produce some consolidation with a downward bias. If last year’s slide represented downward wave [i], then we believe the index is currently tracing corrective wave [ii] of a larger pattern. This suggests that traders might find relatively quick short trades as well as somewhat more risky long trades between now and the middle of 2016.
Our assignment of a downward impulsive wave from the early 2015 high was confirmed in part by the way the index broke through the lower boundary and lower harmonics of the channel shown on the weekly chart below. Typical of fourth wave behavior inside a larger wave [i], price climbed up to retest broken support from below before falling away again. The German DAX manifested a similar break and retest of support last year.
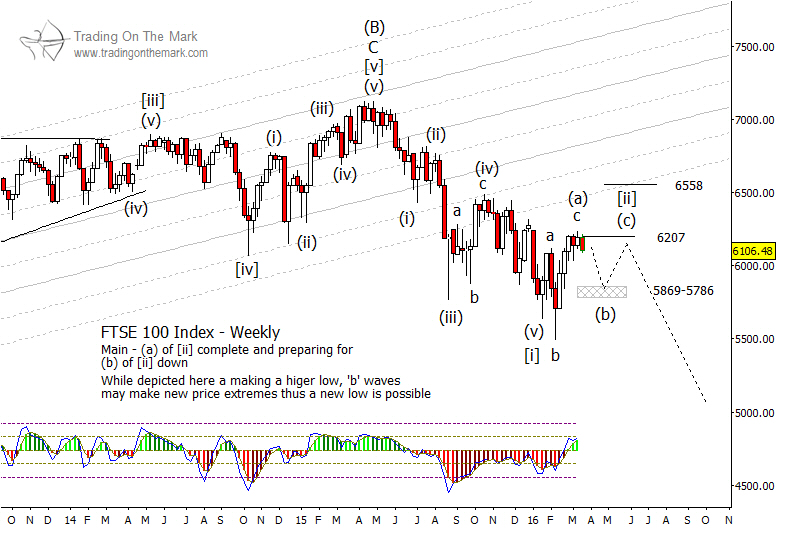
In this scenario, wave [i] in FTSE should be merely the first part of a larger five-wave [i]-[ii]-[iii]-[iv]-[v] structure downward during the next few years.
Looking forward in the near term, FTSE appears to have completed a three-wave move up, which we have provisionally labeled as (a) of [ii]. That should lead to downward wave (b) and upward wave (c), but wave (c) does not necessarily have to exceed wave (a) in price. While the support zone we have drawn on the chart from 5,786 to 5,869 represents a reasonable place for downward wave (b) to terminate, the less risky trade will be to look for short entries nearer to the completion of wave [ii]. Standard Fibonacci resistance areas include 38.2% at 6,207 and 61.8% at 6,558. The first of those areas appears to have capped wave (a) and could possibly cap wave (c).
Our April newsletter will offer forecasts for gold and silver markets. Click here to request your copy!