

Want to know why global growth has sputtered?
Or maybe why inflation has been so elusive for the developed world?
How about why the market has become more volatile?
If so, then there’s one concept you need to understand above all others, and that is debt.
Debt drives everything, from short-term business cycles to long-term secular trends. These debt cycles have nothing to do with Pi, Kondratiev, Elliot Wave, or any other “secret universal force”. But they have shown up in history time and time again dating back to biblical times.They are simply the logical progression of events that repeat due to predictable human nature and the structure of our monetary system. This theory of debt cycles was developed by Bridgewater (the most successful hedge fund of all time).
There are three economic forces that work together to create this progression are:
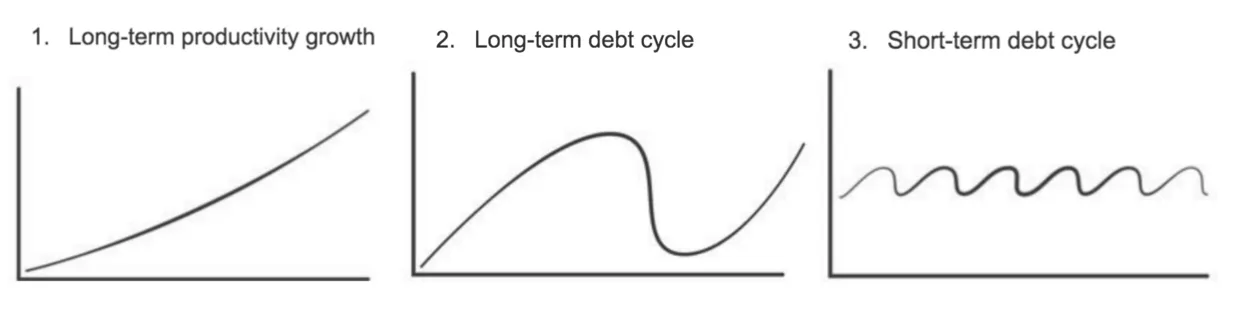
(Charts via Bridgewater “How The Economic Machine Works”)
Long-Term Productivity Growth
Our economy’s long-term average productivity growth rate is 2% a year. This 2% arises from a combination of our society’s increase in knowledge and subsequent efficiency gains. The economy becomes more productive over time and real GDP per capita increases as a result.
But the 2% is just an average. Our actual growth rate fluctuates around that level because of credit. Credit allows us to pull forward our future consumption by taking on debt. So instead of accepting a mere 2% a year, we use credit/debt to juice that growth rate.
Here’s the thing though, if you pull future consumption forward, at some point you reach that “future”, and that consumption you pulled forward won’t be available. At that point, growth falls below the average.
Basically, if you want higher growth today, you’ll have to pay for it with lower growth tomorrow. These cycles of higher and lower growth around the 2% productivity trendline are called debt cycles. They are made up of leveragings and deleveragings of credit/debt.
A leveraging occurs when debt spending increases over time. This debt spending enables us to pull future consumption forward, as previously discussed. It causes a temporary increase over the 2% productivity trendline.
Eventually this debt increases to a point where its servicing costs become too much to handle. Interest payments hamper further demand, causing it to decline. This is when the deleveraging process begins and we fall below the 2% productivity trendline.
These leveragings and deleveragings are the result of long-term and short-term debt cycles.
The Short-Term Debt Cycle
The short-term debt cycle (also known as the business cycle) occurs every 5-7 years. It’s largely dependent on the Federal Reserve’s actions to ease and tighten the money supply through interest rate manipulation.
When the Fed lower rates, we get the boom part of the cycle, and when they raise rates, we get the bust.
Lower interest rates makes credit/debt cheaper. Cheaper credit leads to more people and businesses borrowing. The increased borrowing in turn boosts demand as everyone has more money to spend. And since one person’s spending is another’s income, incomes rise, further driving demand.
At the same time, lower interest rates lowers the discount rate at which businesses and financial assets are valued. A lower discount rate increases the present value of the asset, making it more attractive for investors to bid up.
The whole process is reflexive.
An increase in demand (and a lower discount rate) inflates asset prices (stocks, housing, etc.) which in turn increases people’s net worth. A higher net worth results in a stronger credit profile. A stronger credit profile means you can borrow more. Increased borrowing leads to greater spending, which boosts demand and starts the loop all over again.
But eventually the cycle becomes too much. Producers can’t make enough products to keep up with the credit-fueled demand. At this point, we end up with too much money chasing after too few goods. This is when prices start to rise and we get demand-pull inflation.
This inflation gets the Fed’s attention. One of their mandates is to keep inflation in check, so when they see it rising too fast, they take action and raise interest rates. The higher rates then sends the reflexive loop into reverse.
Higher interest rates makes debt more expensive. It’s not as easy to get new credit. People and businesses end up borrowing less, which causes spending and demand to fall. And since one person’s spending is another’s income, incomes drop, further decreasing demand. Asset prices fall and cause credit standings to drop, which means less borrowing and even less demand. The cycle goes on and on until the economy slows too much, which is when the Fed cuts rates once again.
But this time the Fed has to cut rates even lower than before. Debts have grown since the last time they cut, meaning total costs to service debt have increased. To account for the increase in total debt over multiple short-term cycles, rates have to hit a new low to enable people to still service it.
You can see an example of this process below:
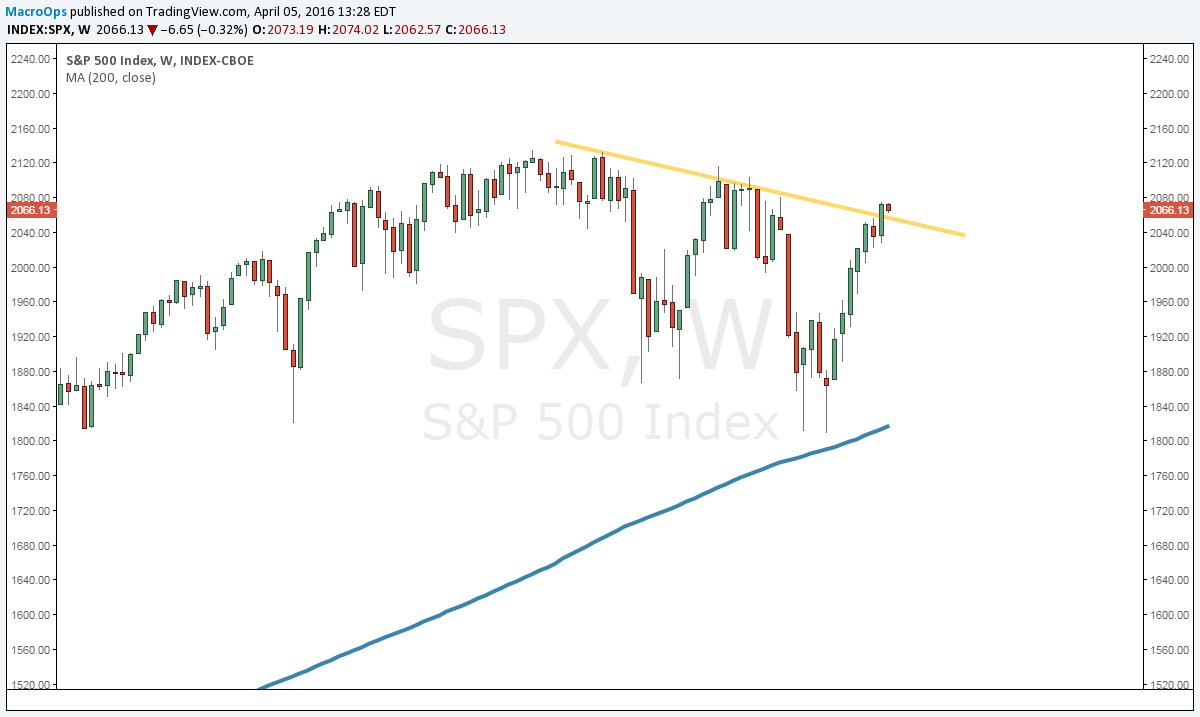
From 99’ to 00’ the Fed increased rates, causing the economy to go into a recession. Once in a recession, the Fed quickly cut rates to a point lower than the previous cycle low. GDP per capita increased from there.
The same thing happened in 04’ to 07’. The Fed raised rates to subdue inflation and then had to cut them again in 08’ to a lower point than the previous cycle.
This cycle repeats again and again until rates can’t be lowered anymore (they reach zero or negative). This is when a pivot occurs in the long-term debt cycle.
The Long-Term Debt Cycle
When you string together short-term debt cycles, you get the long-term debt cycle. The long-term debt cycle operates on a much larger time scale and only becomes noticeable at turning points. These usually occur once every generation, or every 25-50 years
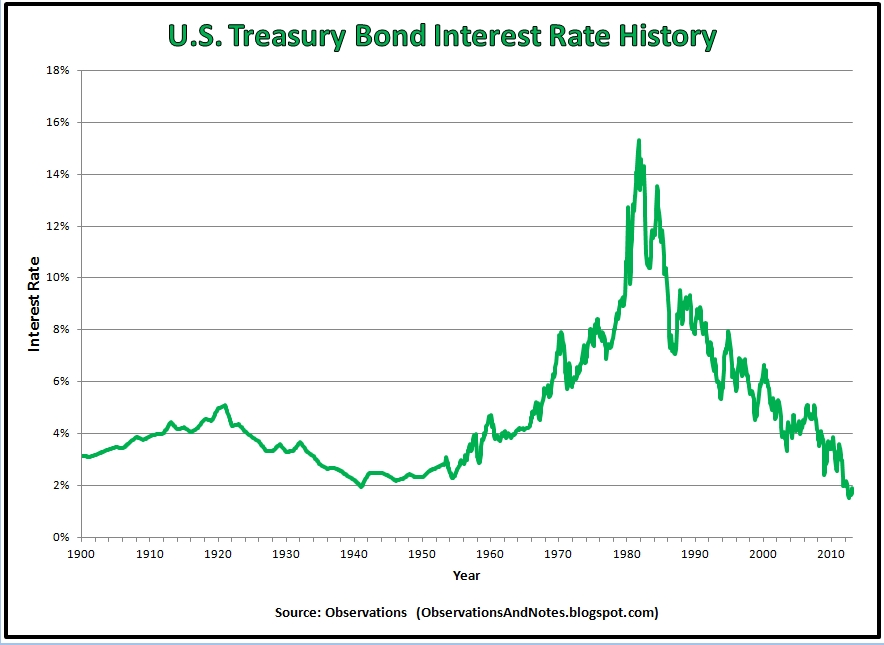
You can see this cycle above. Interest rates peaked in 1920 before turning lower and bottoming out in the 30’s – 40’s. From there they trended higher for the next 40 years until 1981 where they again peaked and turned lower.
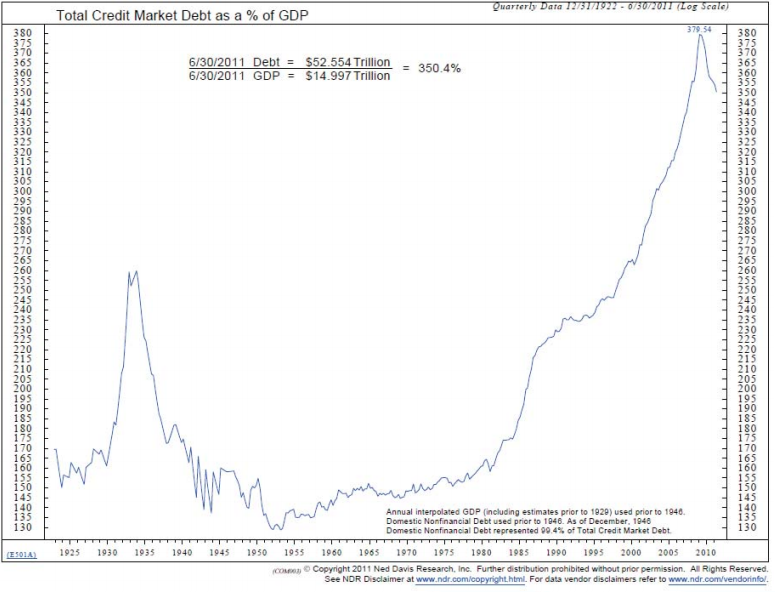
Within these larger secular trends, you have a number of cyclical short-term debt cycles taking place. But over time, total debt accumulates. In the chart below, you can see two major debt peaks. One was in 1929 when total debt peaked at 260% to GDP. The other is today, where debt is at 380% to GDP.
Debt cannot continue to be accumulated forever. Eventually, interest rates can’t be lowered anymore to keep the borrowing going. Debt levels become too high and servicing costs too large. People aren’t able to borrow and spend anymore.
This is our current situation. The debt system is maxing out as we hit the zero bound in our interest rates. The Fed won’t be able cut rates much further.
This reality means we’re near the turning point of the long-term debt cycle. The last time this happened was in the 1930’s… during the Great Depression.
The next step is to go through a massive deleveraging. And deleveragings are painful. Demand is destroyed as the economy resets itself and debt is cleared.
This is coming at the same time as our short-term business cycle turns. Our current business cycle is the 3rd longest in history without a recession. We are long overdue for a correction, and our team at Macro Ops believes we will enter one by the 4th quarter of this year.
And what’s even worse this time around compared to the 1930’s is that most of the world is going through a deleveraging at the same time. And never before have global debt levels been this high or the world so interconnected. Things have the potential to get really bad.
This is the reason global growth has slowed. It’s also the reason for the paltry inflation we’re experiencing. With so little demand due to overbearing debt levels, it’s tough to get healthy price increases.
The volatility we’re seeing in the markets right now is only the beginning. The bear will be in full force for the next few years. Make sure your risk control is tight in order to survive the coming storm.
For more information about debt cycles, please click here.

