

Every week we will analyse major markets across the investing spectrum from commodities and energy to equities and bonds all from the Elliott Wave perspective. I will attempt to give you a picture of the short and medium term posture of the market in question and the likely path ahead for prices, along with the active and alternative Elliott Wave counts for those markets.
For more information on the Elliott wave principle and some easy tips on how to trade using the wave principle you can read How to identify trends, tops, and bottoms using elliott wave theory.
Crude Oil
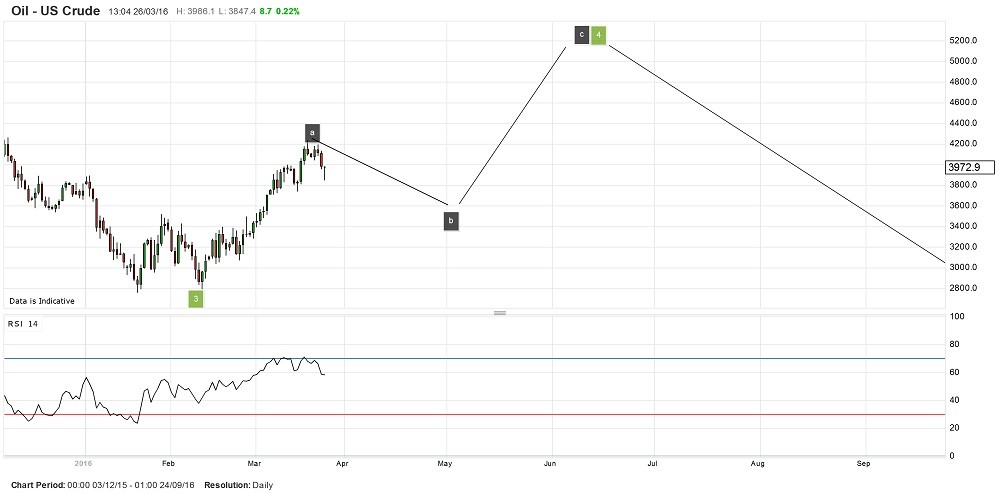
Crude oil is moving higher in a corrective pattern, wave ‘a’ is possibly complete and a wave b down is beginning.
I would expect to see sideways to downwards action over the next few weeks in a wave ‘b’. This week saw the RSI top out in the upper range, suggesting the rally is nearing a high.
Medium Term:
Short Term:
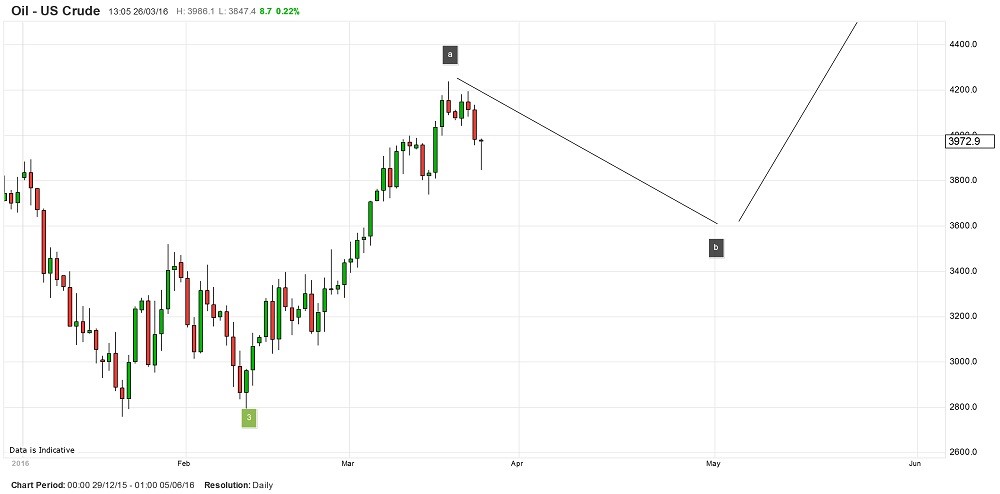
The most recent high formed a decent ‘hammer candle’, this is a bearish candlestick pattern which foresaw this weeks 400 point sdecline. Continued weakness should be expected over the coming weeks to complete wave ‘b’.
B waves usual retrace about 50% of the previous A wave, in this case we should expect a three wave decline to approximately $35. I will then be looking to go long for the wave C rally.
GOLD
Medium term:
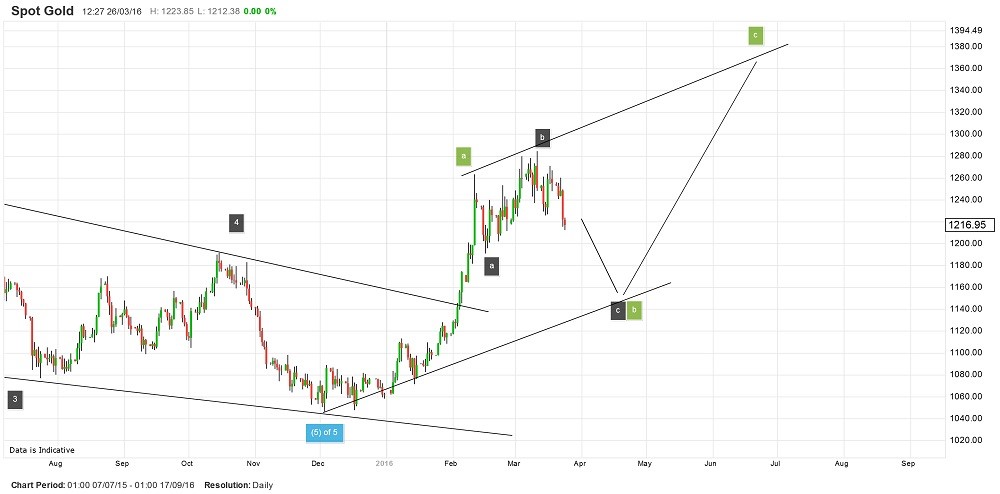
As with crude oil, gold is in a medium term counter trend rally higher. This rally should take a 3 wave form labelled A,B,C. Wave A seems complete, with the last few weeks action being a sideways to downward wave B, and wave C up to follow in the near future.
Short term:
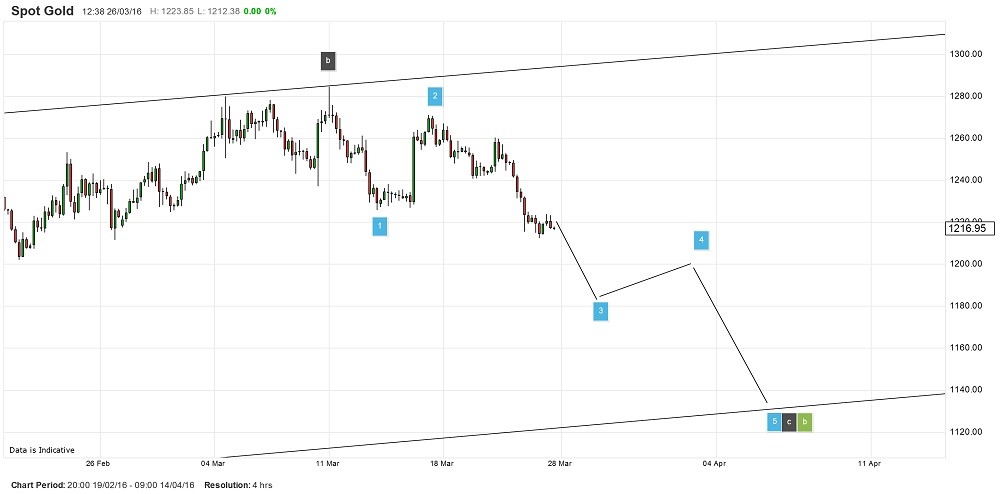
The shorter term wave count views the price correcting in wave B. and right now we seem to be nearing the end of this structure. The final leg down should break down into five waves, It looks like wave 1 and 2 are complete with wave 3 underway this week.
Next week should bring further weakness for the gold price to complete wave 3.
The wave labelling in the chart above shows a possible form that the price might take within the 5 wave structure.
The target at the moment for Wave B is in the region of 1160.

