An examination of all US Presidential election years shows a peak in equity markets in early April followed by a drop into early June. The June low serves as a launching pad for equities to rocket to new highs by year-end not-withstanding the typical Sept/Oct weakness. A low in June matches the Lindsay forecast.
However, when an election year is the eighth year of a Presidential term we get a different result. Like normal election years, equities print a top in early April and a low in early June. The rally following the June low lasts but one month before equity indices decline to new lows with the sell-off accelerating in the Sept/Oct time-frame. No final (seasonal) low is expected prior to late November.
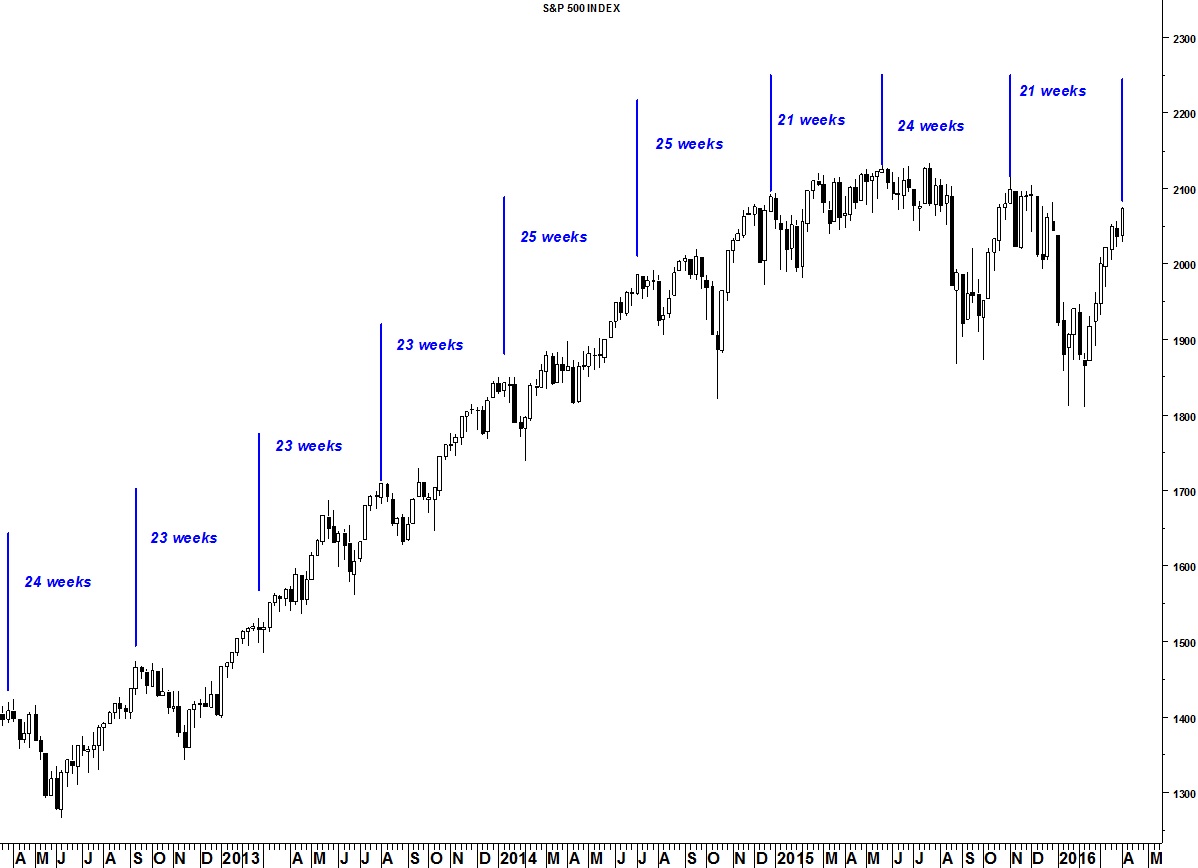
The chart shows a weekly cycle that, since 2012, has stretched from 21 to as long as 25 weeks between highs in the S&P 500. As the previous iteration, at 24 weeks was long, it seems likely that this cycle high will fall on the short side of the average duration. Last week marked 21 weeks since the previous high in November. This cycle also matches the Hybrid Lindsay forecast for a high last week.
Try a “sneak peek” (trial subscription) at Seattle Technical Advisors.com