

In the weeks since our last post about USD/JPY futures, price has moved upward and slightly beyond our resistance target. That move provided a brief countertrend trading opportunity, and now it may be time to shop for another trade in concert with the larger downward trend.
Viewing the overall decline from the Yen’s 2011 high as an impulsive wave ‘A’, we believe the pattern has shifted into corrective mode. Wave ‘A’ probably is complete, but the subsequent wave ‘B’ can involve a test of last year’s low. The monthly chart shows how the middle part of wave ‘B’ (specifically sub-wave [b] of ‘B’) could approach or even fall slightly beneath the end of wave ‘A’.
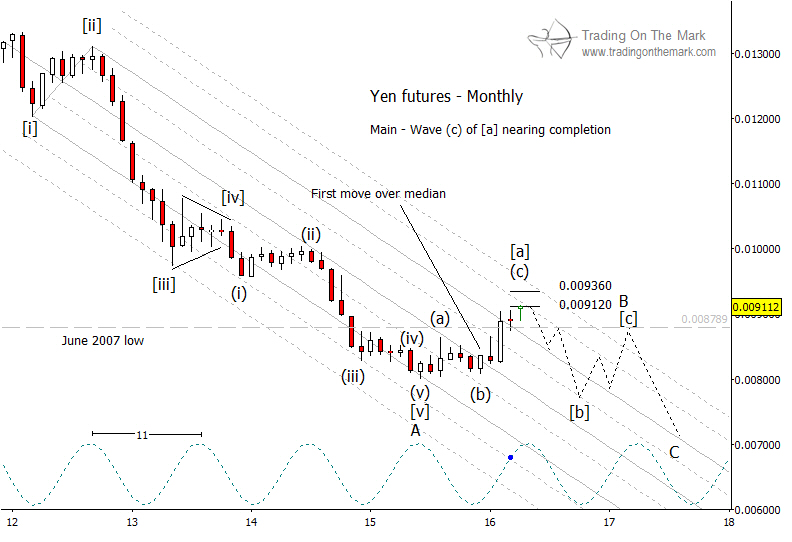
Normally, ‘B’ waves don’t produce the safest or most rewarding trades. However, circumstances with USD/JPY are a bit unusual. There is a strong downward trend in place, with price fitting well inside a guiding channel. Also, a three-wave pattern in sub-wave [a] appears to have completed at a price area that marks a lower high in the big picture – considerably beneath the high that was part of sub-wave [iv] of ‘A’ in 2013.
In addition, a downward swing from near the present area would align with the dominant 11-month cycle, which is currently near a high.
Going forward, watch the areas near 0.009120 and 0.009360 as likely resistance that could produce a downward reversal. For those using the inverse chart, the corresponding areas would be near 109.65 and 106.84 as supports.
Our April newsletter will offer forecasts for gold and silver markets. Click here to request your copy!

