The S&P 500 has been consolidating and traversing the same ground for nearly a month now. So this begs the question, what’s next? How can you know when the next directional move is upon us?
Click here to watch a video explaining how to read the stock market using volume at price.
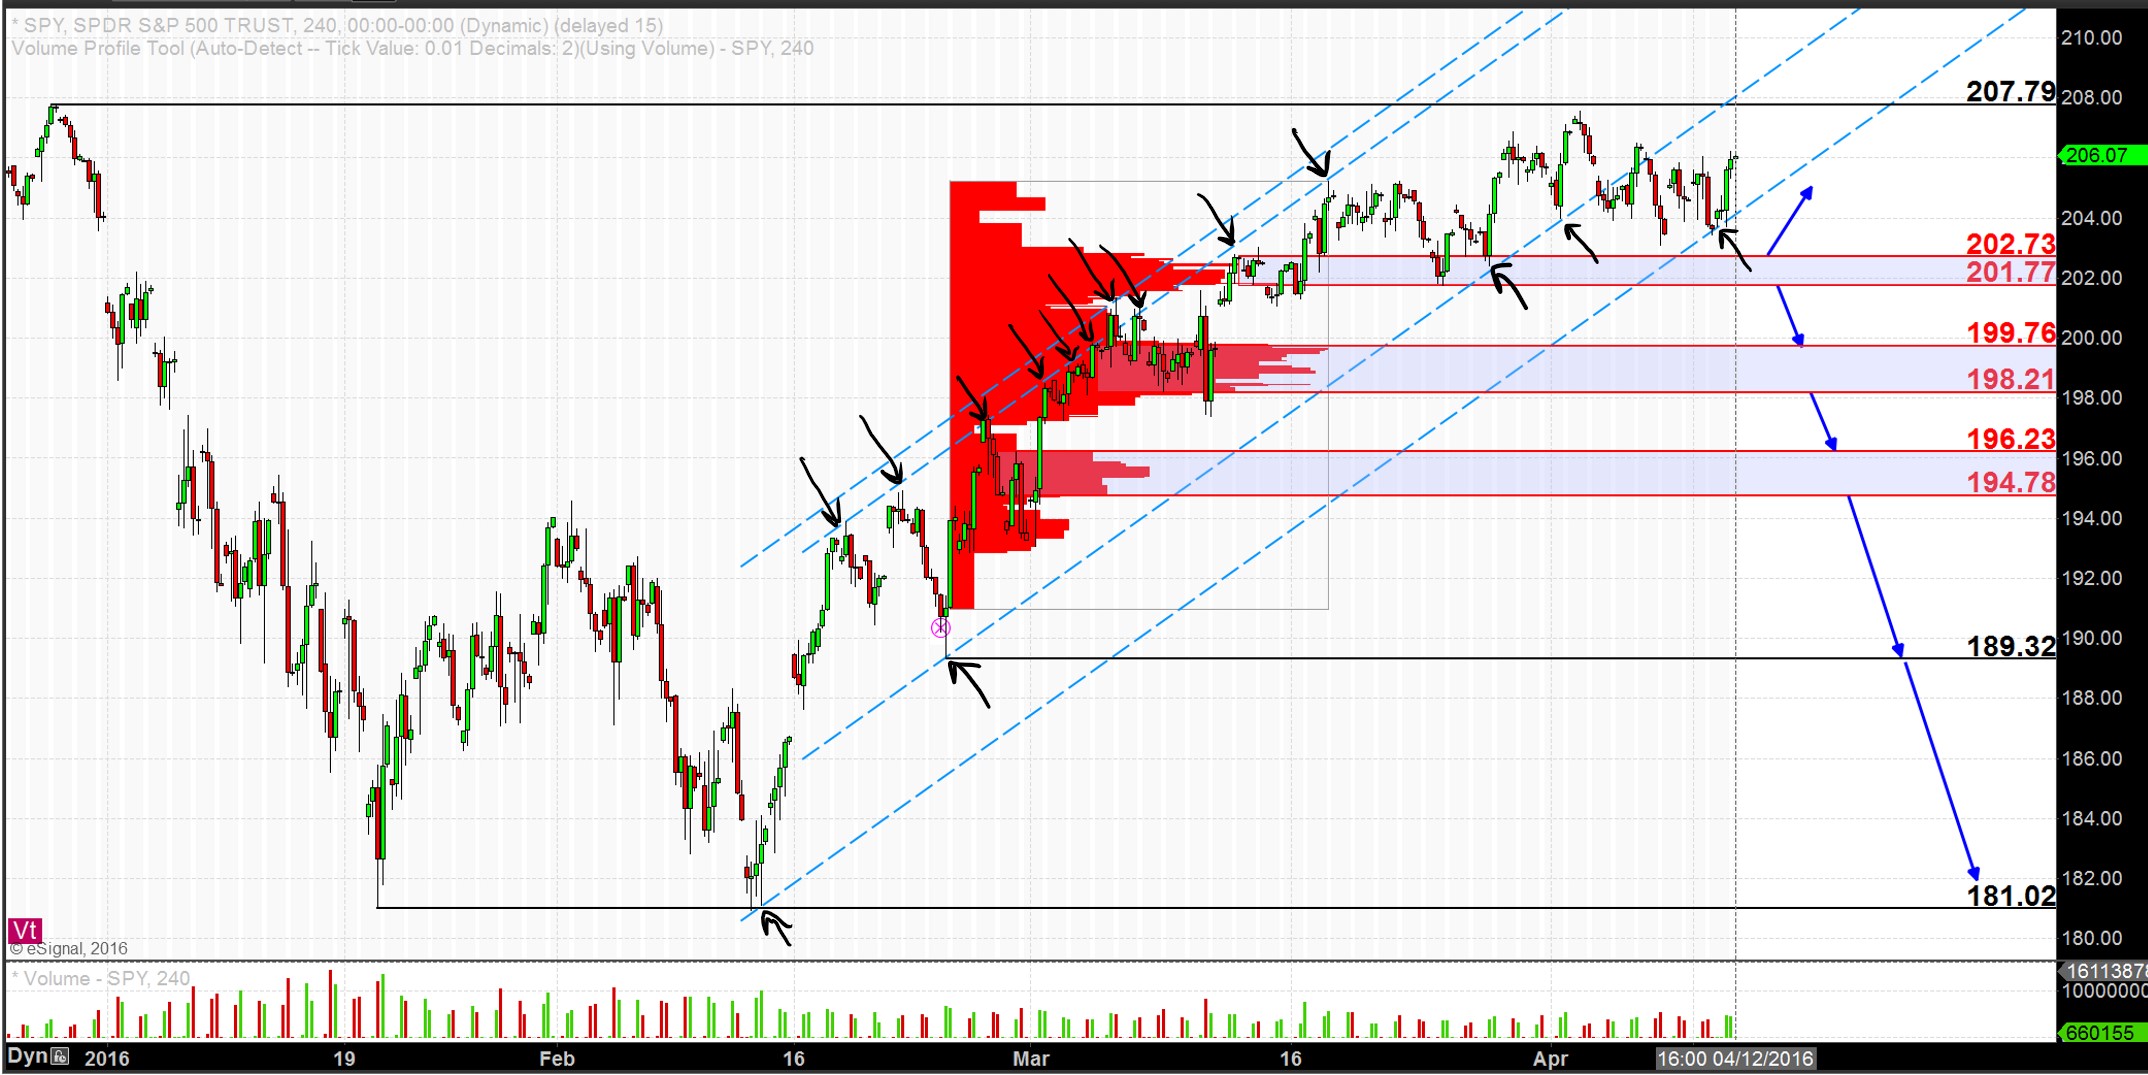
The chart below shows the SPY. The two most important aspects of this chart I’d like to draw your attention to are the trend channel I’ve drawn and the zone of support at 201.77.
The slope of this trend channel was defined by the many multiple highs on the rally over the course of the month of March.
Following a couple of successful tests of volume-at-price support at 201.77 – 202.73, the SPY went on to make the early April high and has since dropped to the lower extreme of the channel. A breach of this channel would be an initial sign of weakness and a subsequent breach of 201.77 would signal a new directional move to the downside underway.
Conversely, while this trend channel and the support at 201.77 – 202.73 remain intact, the larger upward bias also remains intact.