The SPX made a new high for the year last week. So why aren’t we cheering?
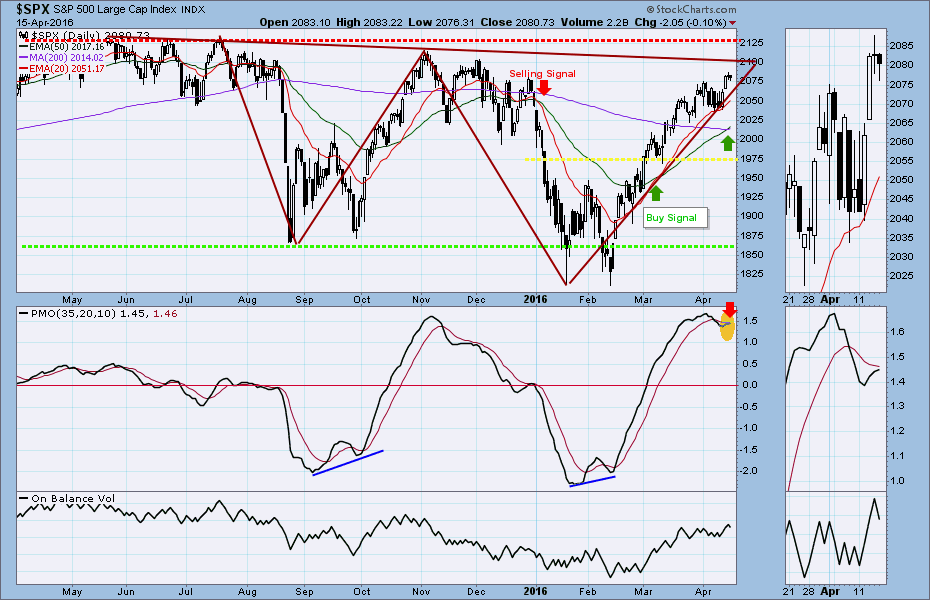
The S&P 500 cash index ($SPX) closed at 2080.73 last Friday, up 53 points from the previous week’s close, and made a new high for the year. But the last two days — after the index options expired — were virtually motionless. Friday was the smallest daily range of the year, barely seven points from high to low.
The market made a higher high and higher low – even the losing weeks (there have been only two since the middle of February) make higher lows – and closed above an important resistance area around 2075.
But that dead halt in the last two days of the week, as if everyone lost interest after the settlement for the index options was established, is very disturbing. What if everybody decides to just stop, leaves the machines running, and wanders off to smell the flowers?
Other things are vaguely disturbing too. Last week we had the Fed holding an unscheduled and unexpected meeting, then a private meeting between the President and the Fed Chair. No explanations forthcoming.
Obviously they know something we don’t know. The rest of us are just guessing. But one juxtaposition is a little scary.
Last week Saudi Arabia warned that it may dump its US dollar holdings, all of them, if there is any possibility the Kingdom might be found culpable in a US court in connection with 9/11. What they’re worried about is the 28 pages censored out of the official 9/11 report, which is widely believed to implicate the Saudis, and which may be released soon.
The amount of US treasuries held by the Saudis is not known — the US Treasury publishes the holdings of US paper for every nation in the world, with the sole exception of Saudi Arabia – but the $750 billion, third largest holding in the world, is the current estimate.
That’s enough to put a serious dent in the bond bubble, and that might have been one of the topics under discussion when Obama and Janet sat down for coffee.
Something smells funny, but we’re not likely to find out what it is. At least not before November.
This week
Over the weekend OPEC failed to reach agreement on cutting oil production, and the crude futures dumped $2 a barrel as soon as the market opened Sunday night. That also dragged down the S&P mini-futures, which are the tradable surrogate for the large-cap index when the markets are closed. Both recovered slightly, but there may be sparks flying when the market opens this morning.
The president is travelling to England to try to persuade the Brits to stay in the European Common Market (one wonders why) and there is not much in the way of economic reports due during the week.
The Fed is restricting itself to only three public speeches, all of them today, none by the Chair, which is pretty close to radio silence.
In all that emptiness, the likely driver of the market this week – barring the usual unforeseeable dangers – is probably going to be corporate earnings, which have been mediocre but not disastrous.
We’ll be watching for a sign the rally is going to continue, and the sign we want to see is a close above 2100 early in the week. That would mean a definitive break through the resistance that has been holding the market down for the past two weeks.
Failing to break through would likely result in a pull back, perhaps lasting most of the week. But the uptrends are still in place, and any pullback won’t cause material damage to the rally. The major support is around 2000. We’re not expecting it to be broken this week.
One last point: there are now weekly options on the SPX that expire on Wednesdays. They are tending to hold the market up; of the six Wednesday expiration days so far, five have closed higher. Just something to keep in mind this Wednesday.
Today
For the S&P500 mini futures (ES):
The ES had the smallest trading range of the year on Friday. The rally stopped under the major resistance, but did not make a substantial retracement. So we have lack of momentum and a failure to follow through after a big rally on low volume. That makes us suspect the ES is near the top or at the top.
There are several targets still ahead. One is the 2095-2100 zone, the neckline of a long-term potential double bottom pattern. The other is a short-term symmetrical bullish pattern target lying at 2085.50-90.50. Both will be obstacles for current buyers.
Failure to break above 2090.50 could see a profit taking move. The ES may be in the process of establishing an exhaustion top today or tomorrow.
The first major support is at 2035-30 today and second major support is at 2011.50-20.50. We expect to see selling on strength and buying on weakness this week.
Major support levels: 2023-20, 2011.50-09, 2003-1998.50, 1980-75
Major resistance levels: 2084-85.50, 2103-2098.50
Visit www.naturus.com to see Nat’s full outlook for the week ahead, free of charge.
Chart: SPX Daily chart to April 15, 2016