

Last weekend I spoke about the November 2015 high of 17978 as being a critical high in the DOW. The first image below shows the count as of last Friday, with the critical high marked on it.
As that November high was labelled wave ‘B’ then the triangle count that I was working on would be invalidated by breaking that high.
Well, yesterday the market broke that high and now the contracting triangle idea has been invalidated.
So back to the drawing board!
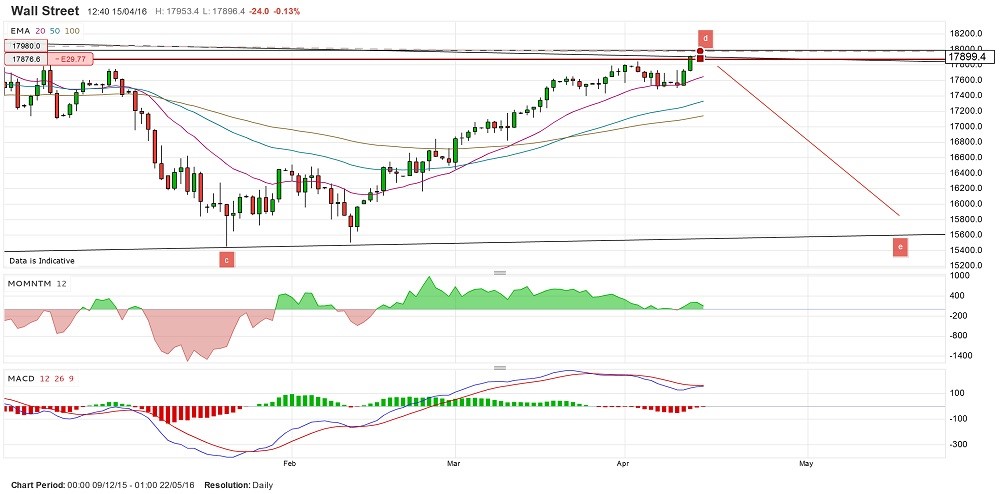
Below is the new preferred wave count:
I am still in favour of a large move to the downside in the medium term, just not in the form that I was previously speculating.
I am now labelling the longer term action as a flat correction, as shown.
A flat correction is still labelled ‘a,b,c’ overalland we are currently coming to the end of the ‘b’ wave.
This ‘b’ wave should stall out before the high labelled wave 3 in the chart below. And if it sits in a parallel trend channel then it projects a large move to the downside straight ahead which will finish around 15000, given that trend channel.
Wave ‘c’ down in this flat correction should trace out 5 separate waves. ( labelled in blue )
This new count has an invalidation point, it is marked in red in the chart.
Let’s see how the rest of the weeks trading proceeds, and if this count will fit the action. I will update the count, as usual, on Saturday afternoon.
All my trades are based on Elliott Wave

