The S&P 500 index continues to work higher but how will we know when this run is over? This is how…
Click here to watch a video explaining how to read the stock market using volume at price.
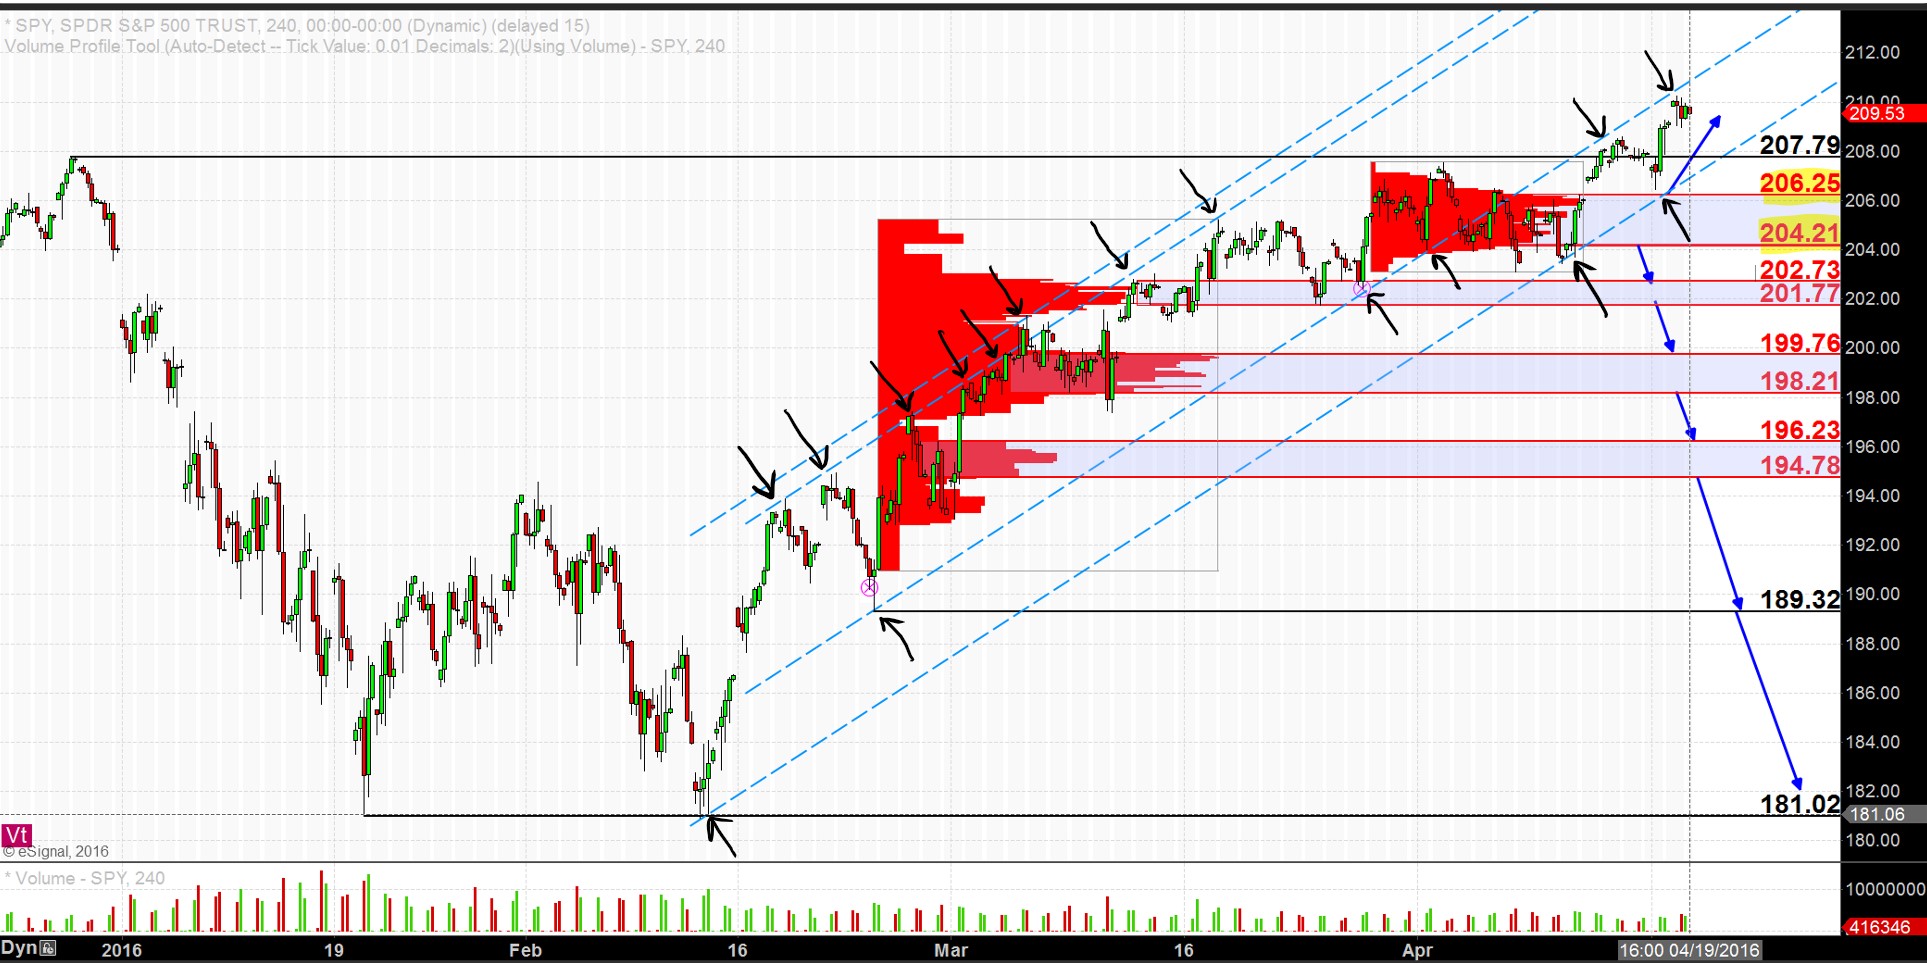
This is an update to my article and analysis from last week on the SPY. The chart of the SPY below shows that it continues to work higher in a well-defined trend channel.
The slope of this trend channel was defined by the many multiple highs on the rally over the course of mid-February to mid-March.
At last writing, SPY was testing the lower boundary of the trend channel just below 204. Since then, SPY has resumed its upward march, pausing and approaching the lower trend channel boundary again near the 206.25 mark before once again responding to the upside.
While this trend channel remains intact, the larger upward bias will also remain intact and the S&P 500 is likely to continue higher in fits and spurts just as it has since mid-February.
When this trend channel is broken to the downside, which will surely occur at some point (it is a certainty), it will be a signal that this large rally phase is over.
The point when important volume-at-price support is breached, currently at 204.21 – 206.25, will likely mark the point when the index will kick off its largest, deepest, longest decline since the beginning of this is rally when SPY was at 181 and the S&P 500 was at 1810.