
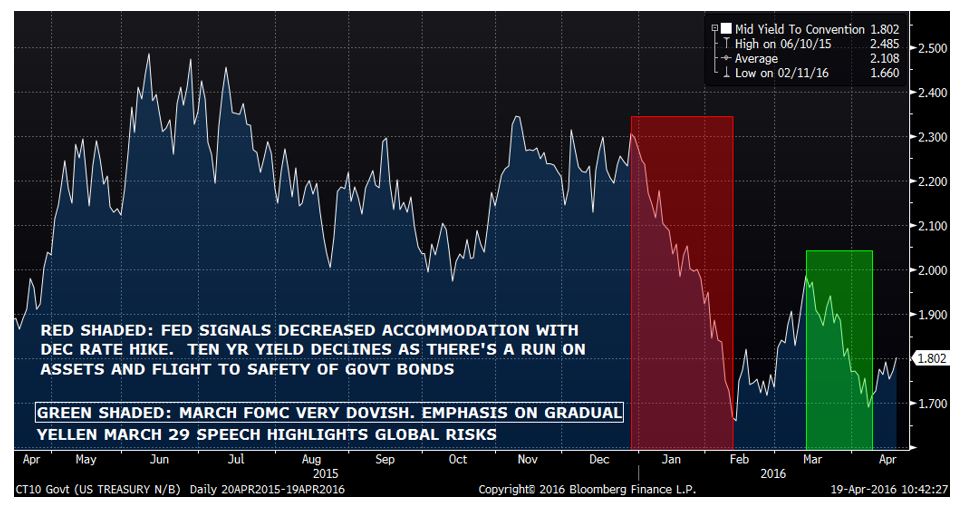
In December, the Fed tightened, signaling reduced financial accommodation. Risk assets took notice, with a rush to the exit doors. This was, of course associated with a flight into treasuries. As can be seen from the chart below, the ten year yield went from 2.30 to 1.66 by Feb 11, the date of peak panic. Stocks began to rally in mid-February, and yields rebounded, with tens nearing 2% into the middle of March. Here is where the conundrum begins. At the March 16 FOMC, Yellen sounded a dovish note. Treasury yields again started to edge down. On March 29, Yellen gave a speech which highlighted general uncertainty, and global risks to the US economy. The ten year yield subsequently dipped below 1.70.
Throughout this time frame, mid-February to now, stocks have continued to rally, gaining 15% from Feb’s low close. However, the ten year yield has barely bounced back to 180. Some find this puzzling. If the equity market rally is reflecting reduced uncertainty and the possibility of better economic conditions, then yields should be rebounding smartly. But they aren’t. Why?
In my opinion, this market action is all about perceptions of central bank accommodation, and has pitifully little to do with underlying economic strength. The Fed signals dovishness, hence the dollar eases, oil and other commodities bounce, concerns over high yield recede, stocks power higher. If this was all occurring in a context of stronger growth and firming wages/inflation, then ten year yields would respond by moving higher in a more confident fashion. Instead, they timidly climb a few basis points. The lowest yield of the entire crisis was 1.39 in 2012. We’re less than ½ % away. The interest rate market is saying that it’s not convinced that the central bank can sustainably spur growth and inflation. The stock market is being pumped up strictly by easier financial conditions, and there are increasing signs that central banks are reaching their limits of influence.
QUICK UPDATE ON PREVIOUS POST: On April 12, I posted Gold/Silver Ratio Looking Vulnerable. At the time, the ratio was 77.5. With Tuesday’s explosive rally in silver (SIK6 up 70 cents to $16.99), the ratio has fallen just below 74. I continue to target 70-72.
Alex Manzara

