A major area of confusion for Technical Traders is the analysis of Trends on stock charts. Most traders have been taught that the Stock Market trends up, down, or is “trendless.”
There are actually distinctly 5 Trends, and within those trends are 5 Trendline Patterns.
Today the discussion will be on understanding the 5 Trends, which are best identified on 3 Day View or Weekly View charts.
Trendline PATTERNS are recognizable primarily on Daily View charts.
Proper identification of Trends on stock charts helps traders prepare for Reversals and Breakouts. Both shifts of Trend are critical to see in the price action before the Reversal or Breakout occurs, if you wish to take advantage of the huge price movement which results.
Reversals
Reversals are Trend directional changes, when the Stock or Index is trending up or down. Reversals change the direction of price action, often abruptly and without warning. Chart price patterns such as Velocity of Price, Volume Patterns, and Angle of Ascent™ all help the Technical Trader see that a Reversal is imminent. This allows the Technical Trader to exit trades on the current up or down Trend, and prepare to trade in the opposing direction.
Reversals are Topping and Bottoming action, and the speculation of a top creates huge momentum runs down. Conversely, panic and capitulation selling in a Downtrend create a huge momentum bargain hunting action Reversal pattern that begins most Bottoms.
Breakouts
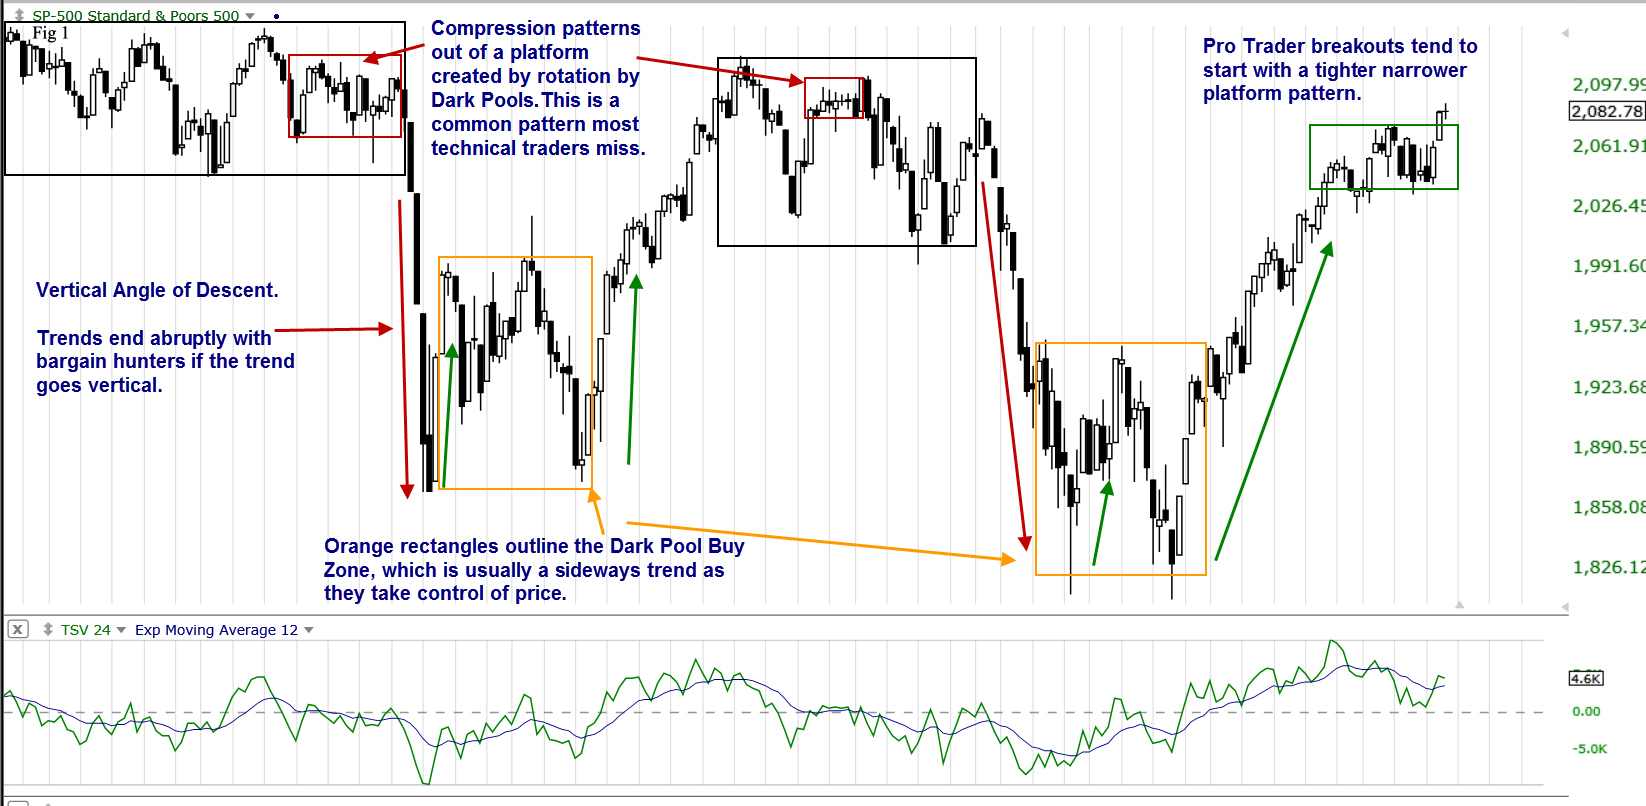
Breakouts occur when the Trend is sideways. There are 4 different dimensions of sideways action. The Amplitude of Price as it moves sideways determines whether the sideways pattern is a Consolidation, Platform, Trading Range, or a moderate sideways pattern. Compression patterns usually precede Breakouts, and are a key element in recognizing a Breakout is imminent. Buying or Selling Short during a compression pattern gives traders the opportunity to earn higher profits.
The S&P500 Index chart example below shows several different Trends, Reversals, and Breakouts.

Learning to identify the pre-patterns of Trends on stock charts that indicate either a Reversal or Breakout is about to happen, enables traders to react ahead of time rather than after they are underway. This can mean the difference between a successful trading career and chronic losses.
Summary
As you can see on the chart, extreme Velocity Runs that create a steep Angle of Ascent™ and Angle of Descent™ are both part of the Technical Analysis that needs to be done for Reversals.
Also this chart has different sideways patterns, each indicating a different Breakout scenario. By studying the chart Trend patterns beyond just the “Uptrend” or “Downtrend,” Technical Traders can take their analysis to a higher level of professionalism.
Overall the S&P500 is in a Trading Range Trend, which is the widest of all the Sideways Trend Patterns.
Trade Wisely,
Martha Stokes CMT
TechniTrader technical analysis using TC2000 charts, courtesy of Worden Bros. Inc.
Disclaimer: All statements are the opinions of TechniTrader, its instructors and/or employees, and are not to be construed as anything more than an opinion. TechniTrader is not a broker or an investment advisor; it is strictly an educational service. There is risk in trading financial assets and derivatives. Due diligence is required for any investment. It should not be assumed that the methods or techniques presented cannot result in losses. Examples presented are for educational purposes only.


