This week the SPX will become the second longest bull market in history. What happens next?
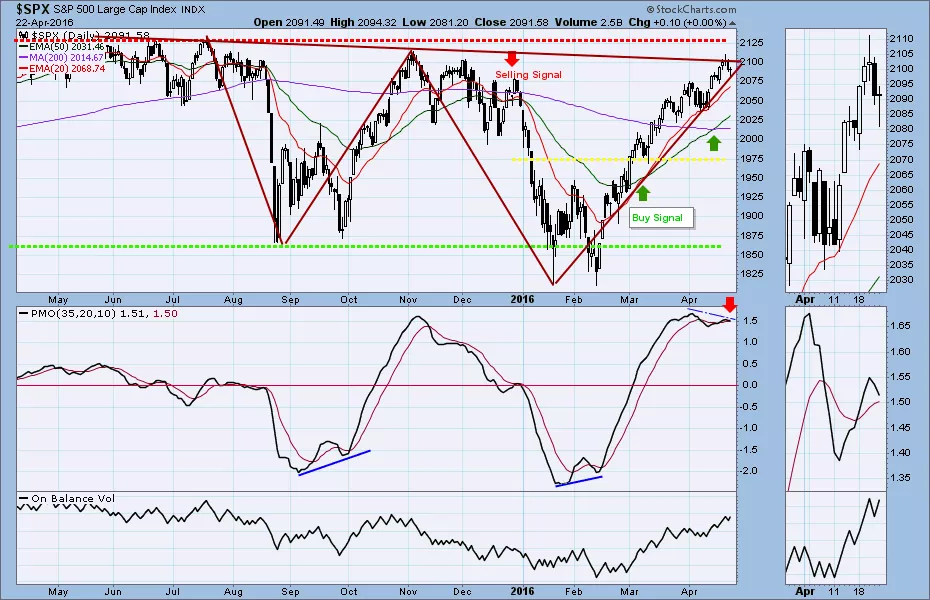
The S&P 500 cash index (SPX) closed at 2091.58 last Friday, up 10.85 points for a net weekly gain of 0.52%. That was hardly a break-out-the-bubbly rally. But it carried the large cap index to a new high for the year – again – and to a level that hasn’t been seen since the start of November. The SPX has now closed green for eight of the last 10 weeks. Not huge gains, but hugely consistent.
There are still lots of skeptics who will argue that this is just the last gasp of a dying Bull market. Maybe they’re right; but on Thursday this will become the second longest Bull market in the history of the US stock market.
According to research prepared by Bank of America, the longest Bull ever started in October 1990 and lasted until March 2000, a total of 3452 days. On Thursday this Bull – if it is still running — will have lasted 2,607 days, displacing by one day the previous second-place holder, which lasted from 1949 to 1956.
So what happened next?
The post-war market of the late 40s and early 50s ended not with a bang but a whimper. It just kind of dropped dead of exhaustion, and was followed by a mild, brief recession in 1956-57.
That’s the good news scenario, what we should hope is in store for us.
The alternative is what followed the bull market that ended in March 2000. It was succeeded by a vicious Bear that took the market down 50% over the next two-and-a-half years. Not what we want for Plan B.
Last week
The large-caps rallied nicely into Wednesday, when the index made a spike high at 2111, before pulling back into the Friday close. Once again we think there is a connection between the new “Wednesday weekly” options and the recent tendency to spike on Wednesdays followed by declines into the end of the week.
The end-of-week pullback has not changed the intermediate-term rally, which we expect to continue after a little pause.
Right now the index is in short-term minor correction process. We are waiting for the short-term indicators to move away from the top of their ranges with a nice pullback, and then we will look for a longer term bullish breakout move again.
This week
In addition to history’s second-longest bull market, we have the Fed meeting Tuesday and the policy announcement Wednesday. Fed days are frequently bullish, and we have the last trading day of the month this week. A little window-dressing is probably in store. The weekly chart looks healthy.
The index could move up to close above the 2100 level if the Fed policy statement encourages the buyers. Alternatively it could drop back to close above the 2050 level at the last trading day of April if the Fed is not sufficiently helpful.
2070-65 will be the key zone to watch this week. A failure to hold that level could trigger a sell signal and push the price down further.
Today
We use the S&P500 mini futures (ES) for short-term trading.
Today the ES could repeat Friday’s range (2089-2075) in the early sessions, as long as overnight trading holds above the first support zone 2071.75-70.50.
2090.50-89 is a key resistance zone. A break above it could lead ES to retest 2100-05, last week’s high. Alternatively, a failure to hold above 2070.50 could lead the ES down further toward the 2061-62 area.
In any event last week’s minor pullback hasn’t completed yet. Short strong rallies and buy on weakness today.
Major support levels: 2052-55, 2023-20, 2011.50-09, 2003-1998.50, 1980-75
Major resistance levels: 2103-2098.50, 2112-17, 2125-28.50, 2135-38
Visit www.naturus.com to see Nat’s full outlook for the week ahead, free of charge.
Chart: SPX Daily chart to April 22, 2016