

In January and again in April, we showed we showed a potentially bearish path into the middle of 2016 and beyond for Australian stocks – a decline that we believe is linked to lowered expectations for China’s economy and trade. Consistent with that view, the Australian Dollar appears ready to make a similar decline during the next year or longer.
In the context of a larger decline that began in 2013, our main Elliott wave count has Australian Dollar futures on the verge of starting downward wave [v] in a [i]-[ii]-[iii]-[iv]-[v] sequence. The question for traders is, when and where will [v] begin?
A standard fourth-wave retracement might be expected to reach upward by about 38% (a Fibonacci ratio) of the span of wave [iii], and that resistance area is near 0.7705. This is shown on the monthly chart below. Although the April candle wick extended slightly above resistance, the body of the candle remained beneath the level.
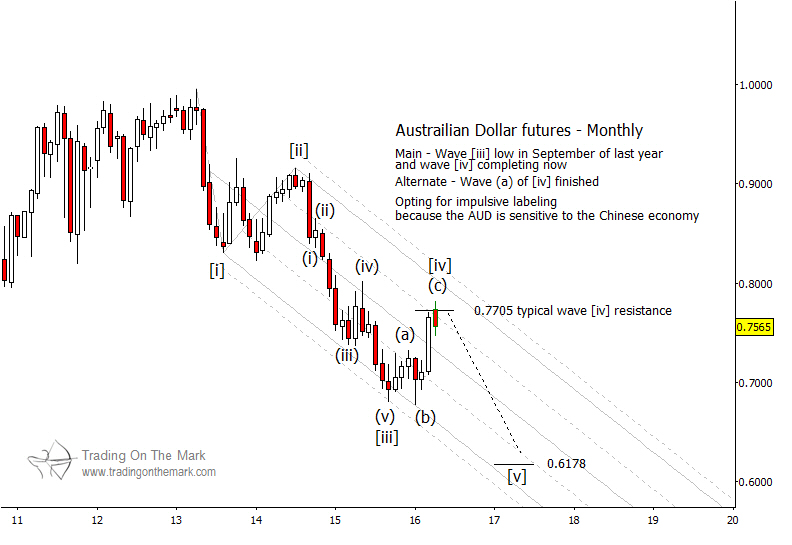
If the high of wave [iv] is set, then a typical [v] = [i] measurement downward suggests the area near 0.618 as the primary target for wave [v].
While our main scenario counts wave [iv] as complete, the corrective pattern could become more complex. In that case, the nearby trade would still be downward. However, traders should be vigilant for exhaustion signals as the decline progresses. If wave [iv] is not yet finished, then the next fallback position would be to treat the rising three-wave structure since 2015 as merely wave (a) of [iv].
Keep up with posts and articles from Trading On The Mark by following us on Twitter and facebook!

