

Crude oil prices rose to yearly highs before pulling back after a survey from Reuters on Friday showed that OPEC production in April reached near-record highs, reiterating concerns related to the massive supply glut on global energy markets.
On Friday a Reuters report cited that OPEC increased production by over 170,000 barrels per day. Iranian output contributed to this increase as production levels climb to 3.4 million barrels per day. Iran hopes to be at pre-sanction levels, of 4 million bpd, by June 2016. This news drove crude prices down off of their yearly highs.
Last Week’s Analysis
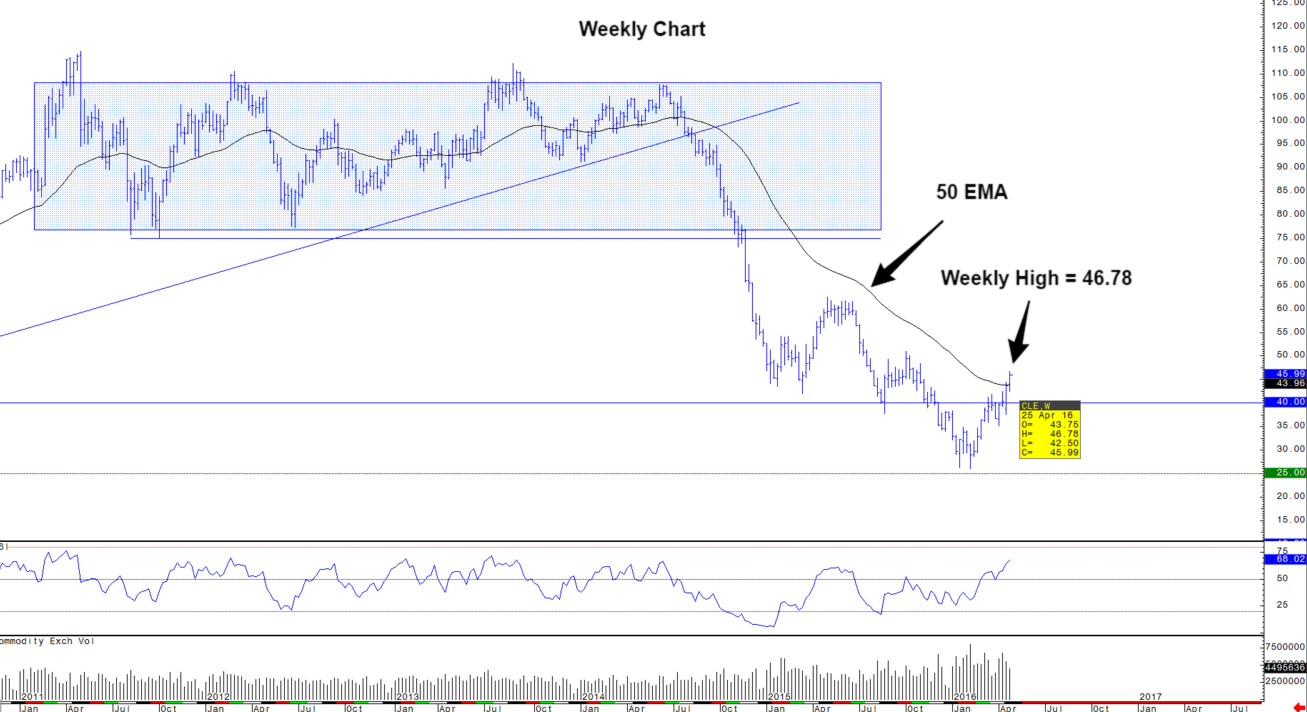
In last week’s analysis (http://www.traderplanet.com/commentaries/view/169627-oil-weekly-technical-outlook-for-april-25th-april-29th/) we projected a level of resistance around the 46.81 level. The high last week was 46.78.
Crude Oil Weekly Chart
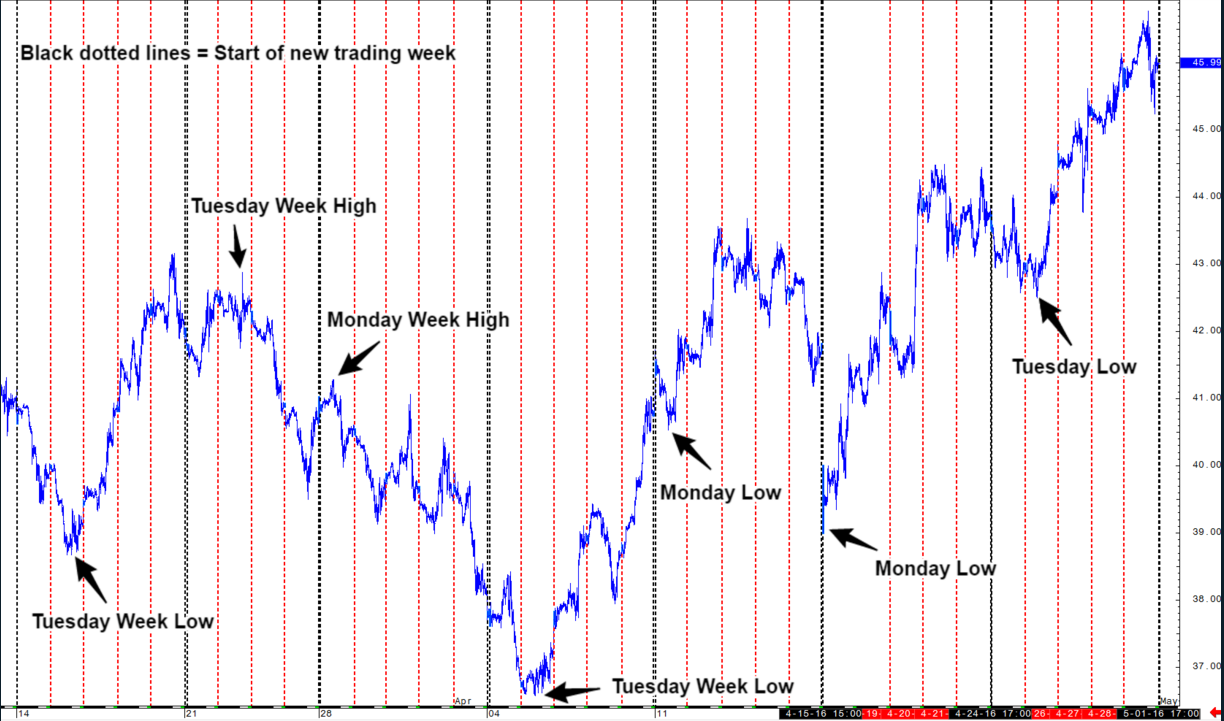
Highs and Lows for a Trading Week
One of the tendencies that we look for when trading crude oil each week is that the high (or low) for the week will be made on a Monday or Tuesday. This allows us to understand the technical bias for the remainder of the week and we can then plan our trades around this understanding of the weekly bias. In the crude oil chart example listed below, you can clearly see how the high (and low) of each week was made on Monday or Tuesday.
Crude Oil Technical Outlook
Crude Oil Daily Chart
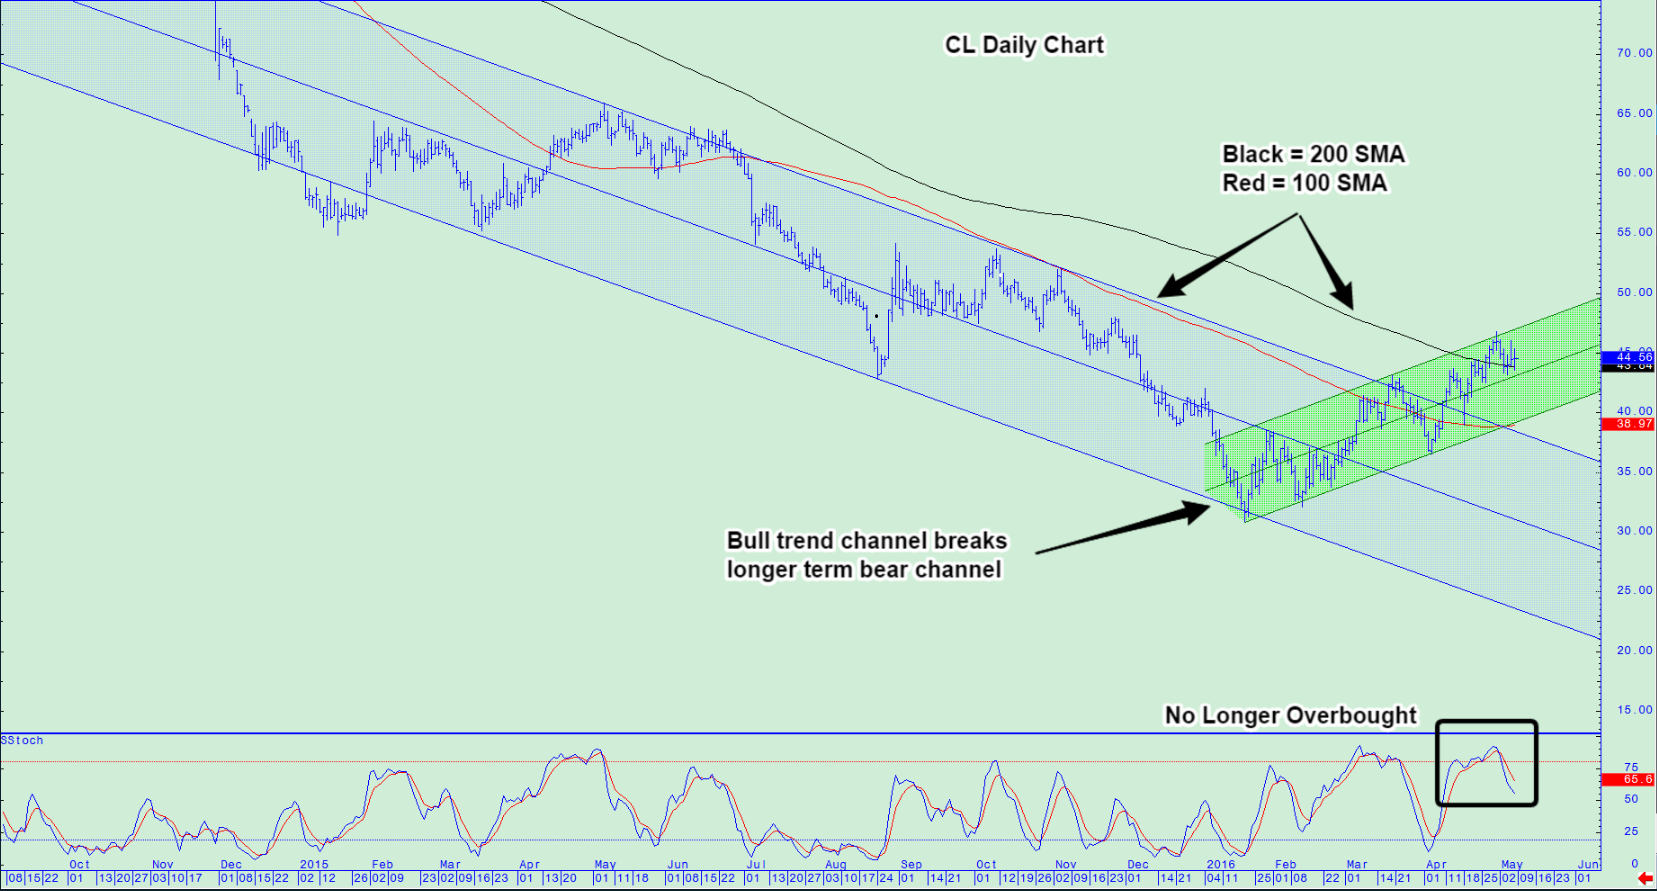
On this chart you see that we have broken 2 structure points on the way up. Having said that we are now overbought on the stochastics, approaching a price congestion area dating back to October 2015 and also, while not a true fib level, the retracement area identified is a potential stopping point. Finally, we have closed trading above the 100 and 200 SMA indicating a bullish shift in price momentum. Overall Consensus: Bullish but cautious as we approach previous market structure and oscillators are overbought.
Crude Oil 60-Minute Chart
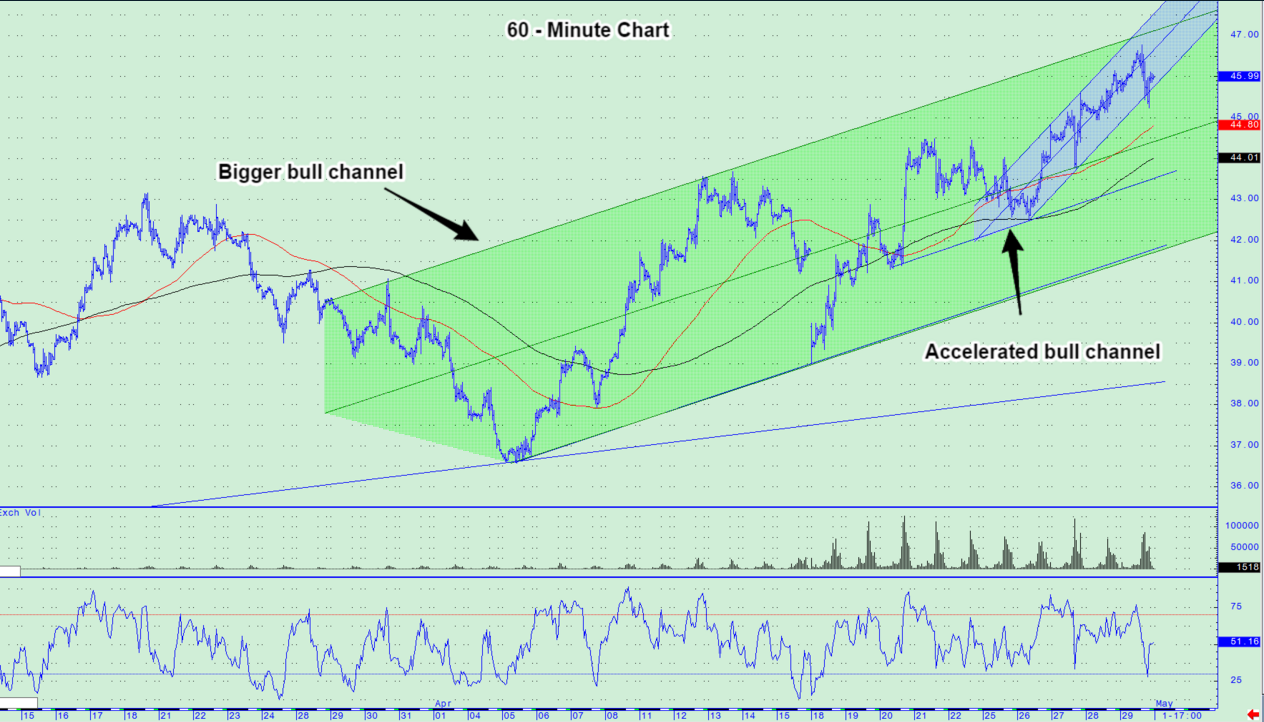
As we entered into the trading week last week, we were in a broader based up-trend on this chart. As you can see we accelerated that up-trend in a bullish channel. The Friday news indicating OPEC production continues to increase as well as the overbought conditions on the RSI facilitated the Friday sell off. Overall Consensus: Bullish but cautious.
Weekly Price Targets
48.11 – 48.56
49.48 – 49.94
52.25 – 52.65
Below the Market
43.53 – 43.08
42.16 – 41.71
39.33 – 38.99

