Once again, we continue with our analysis of the growing imbalance in the metal markets. Today’s focus is on the gold market and the record net long position set by the large speculators this past week. Before we get to the chart, let’s examine the argument typically made regarding Commitments of Trader data. There are two schools of thought. One school of thought posits that the large speculators are the group to follow for two primary reasons. First, they’re only involved in markets that they think are setup to move. They have no obligation to participate other than profit. Secondly, these are the professional speculative traders trading the largest pools of money. Certainly they know what they’re doing, right? The second school of thought argues against this through two key points. First, commercial traders only focus on their market and while and individual may get their estimation of a products value incorrect, rarely does the entire physical commodity sector as a whole misjudge the supply and demand characteristics of the market in question. Secondly, there is a survivor bias that must be accounted for in the large speculators. While the large speculator group is made up of the biggest traders, the biggest traders come and go whereas the producers and consumers of the commodity are in it for the long haul.
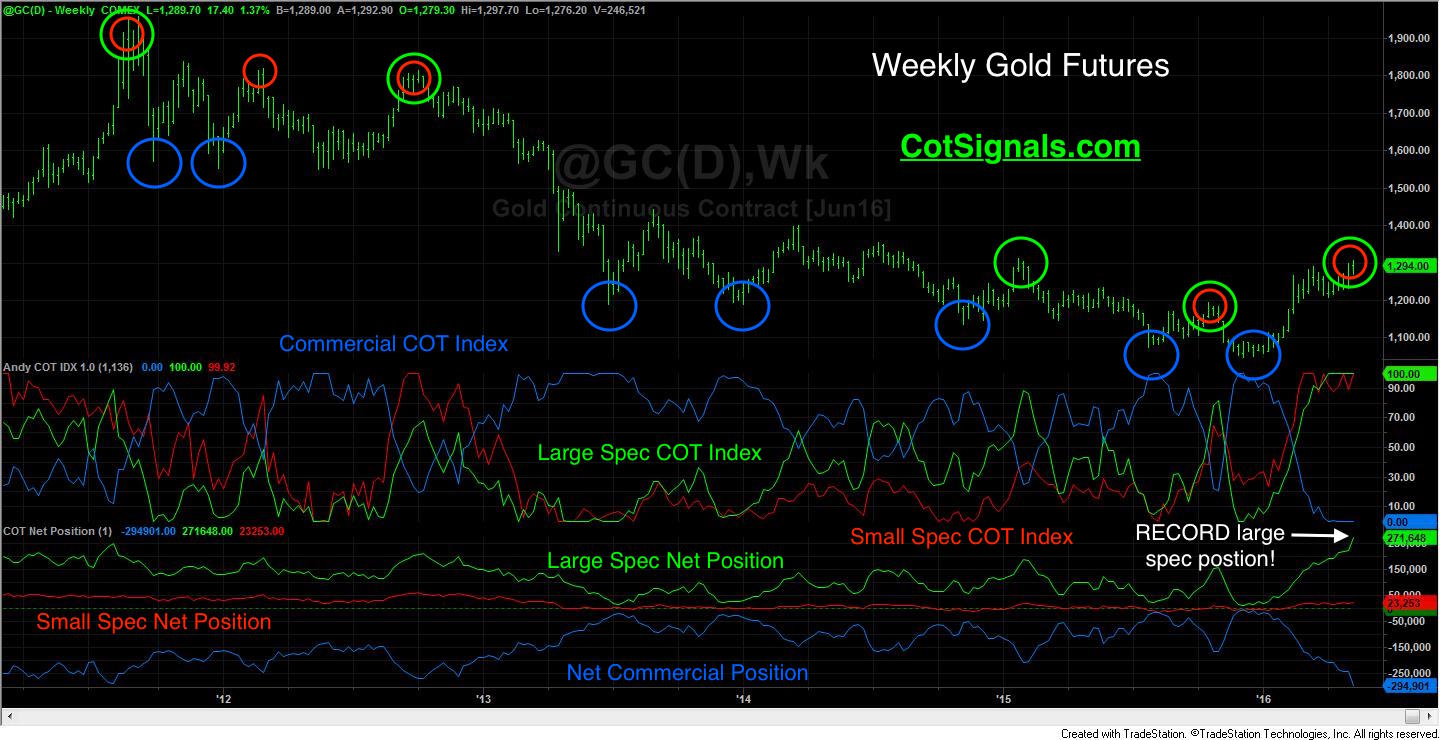
The key point in developing a premise-based trading program is predictability. Moving to the chart below, we’ve plotted both the net positions of the relevant market players and the classic COT Index for each group. The weekly chart contains about five years’ worth of data. Each major high is accompanied by an outsized long position held by either the large or small speculators. And in many cases, by an outsized long position held by both the large AND small speculators. The spikes are bit easier to see on the COT Index in the second pane. Notice that each time the large or small speculator’s COT Index reading nears 100, the market ends up topping out shortly thereafter. One last important note regarding predictability. The small speculator position is too erratic to be relied on in a mechanical fashion. However, noting the market’s position within the cycle of the Index can put us on the lookout for warning signs of a pending turn in the market.
The large speculator and commercial trader categories are far more predictable due to the relative size and professional management of the positions they’ve acquired. Our research has proven over and over that the markets’ biggest turns happen when the market is the most imbalanced. Large speculators have just set an all-time net long record holding more than 270,000 contracts. Ninety-thousand of which have been added since March 18th around $1,250 per ounce. Meanwhile, the commercial traders are merely catching up to their net short totals from 2010. That led to a $150 per ounce decline over the next two months and was the last significant fall prior to the march towards $2,000.
We’ve missed the last $100 run-up in the gold market as the odds continue to tell us to wait for a short selling opportunity. We still view the $1,210 area as the primary support for this rally’s last leg. It’s been our experience that a gold rally bearing the current internal structure is doomed to fall before it can sustain any type of rally. Therefore, we’ll sit on the sidelines with a keg full of dry powder waiting to be used.
We use the COT report to generate nightly mechanical and discretionary trading signals. For more information and a free trial of our discretionary product, please visit COTSignals.com.