On December 16, 2015, the Fed increased the Fed Fund target rate. Since then, there have been mixed messages by various Fed officials, with most using “data-dependency” as a fallback position for the prospect of the next rate hike. Of course, another theme has been uncertainty related to international markets in general, and China’s economy specifically. Many analysts have been forced to trim back their estimates for the number of Fed hikes in 2016, with consensus now settling on one or two. The Eurodollar futures strip, as mentioned previously, is solidly forecasting just one hike this year, as evidenced by the fact that essentially all of the one-year Eurodollar calendar spreads are between 20 and 25 bps. For example, on Tuesday EDU’16/EDU’17 settled at 23 bps, with prices of 99.265 and 99.035. What does this mean? It means that the forward three month interest rate starting in mid-September 2016 (covering the period of Sept 21 to Dec 21) is at 73.5 bps (100-99.265) and the three month period one year forward from then (mid-Sept 2017 to mid-Dec 2017) is 96.5 bps. Between these two periods a new president will be elected and all types of other events may occur. But the market only ‘forecasts’ a change of 23 bps, consistent with just ONE move by the Federal Reserve.
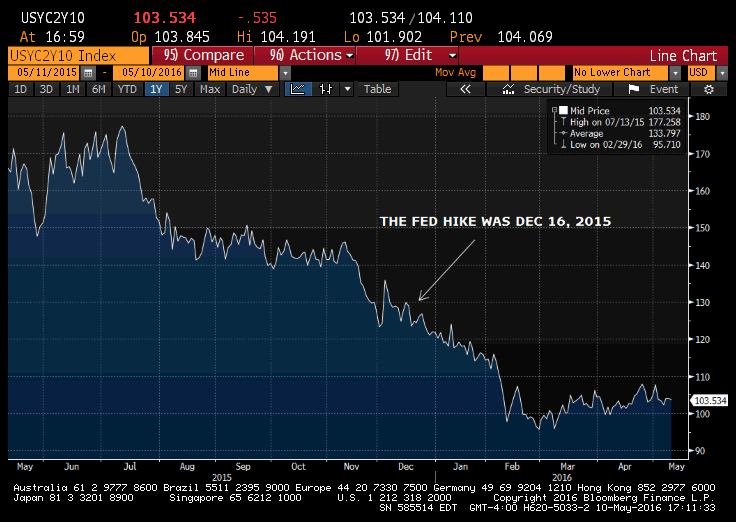
But let’s look further out the curve, at the spread between the two year treasury yield and that of the ten year. A chart is shown below. The two year yield is more sensitive to Federal Reserve policy, while the ten year yield reacts to inflation and growth expectations. As you can see from the chart, this spread has been very stable for the past three months, ranging between 96 and 107 bps. This chart is NOT giving strong indications of inflation and growth. In fact, after the Fed hike in December, the curve became flatter. Of course, the migration of many European sovereign bonds to negative levels has clearly been a factor holding down US yields. However, the fact is that the interest rate structure in the US signals lethargic conditions going forward. This is not to say that stocks are likely to collapse (though a flat curve does correspond to a lack of corporate pricing power), or that another recession is around the corner. Just to say that a change in economic conditions to rosier scenario will be signaled by the spreads mentioned above. Don’t hold your breath….
Alex Manzara


