

The CL technical outlook for last week called for a rally into the $47 handle. On Thursday, the market rallied into that zone on news from the International Energy Agency that global crude inventories will experience a “dramatic reduction” in the last half of 2016. As prices continue to rise in the near term, there will be a fear that this increase in price will encourage producers to begin to increase their output again.
The Baker Hughes weekly data report showed a decline (10 Rigs) for an eighth consecutive week supporting the idea that the continued decrease in production will cause prices to rally. This was indeed the case as the prices climbed up off the Friday lows on the release of this report.
U.S. Dollar Continues to Weaken
The U.S. Dollar Index is down more than 4% since early December. The correlation between Crude Oil and the U.S. Dollar means that the lower USD value will put increasing (bullish) price pressure on Crude.
Since December 2015, as the USD has declined, the price of crude has rallied.
CL Technical Outlook – The Charts
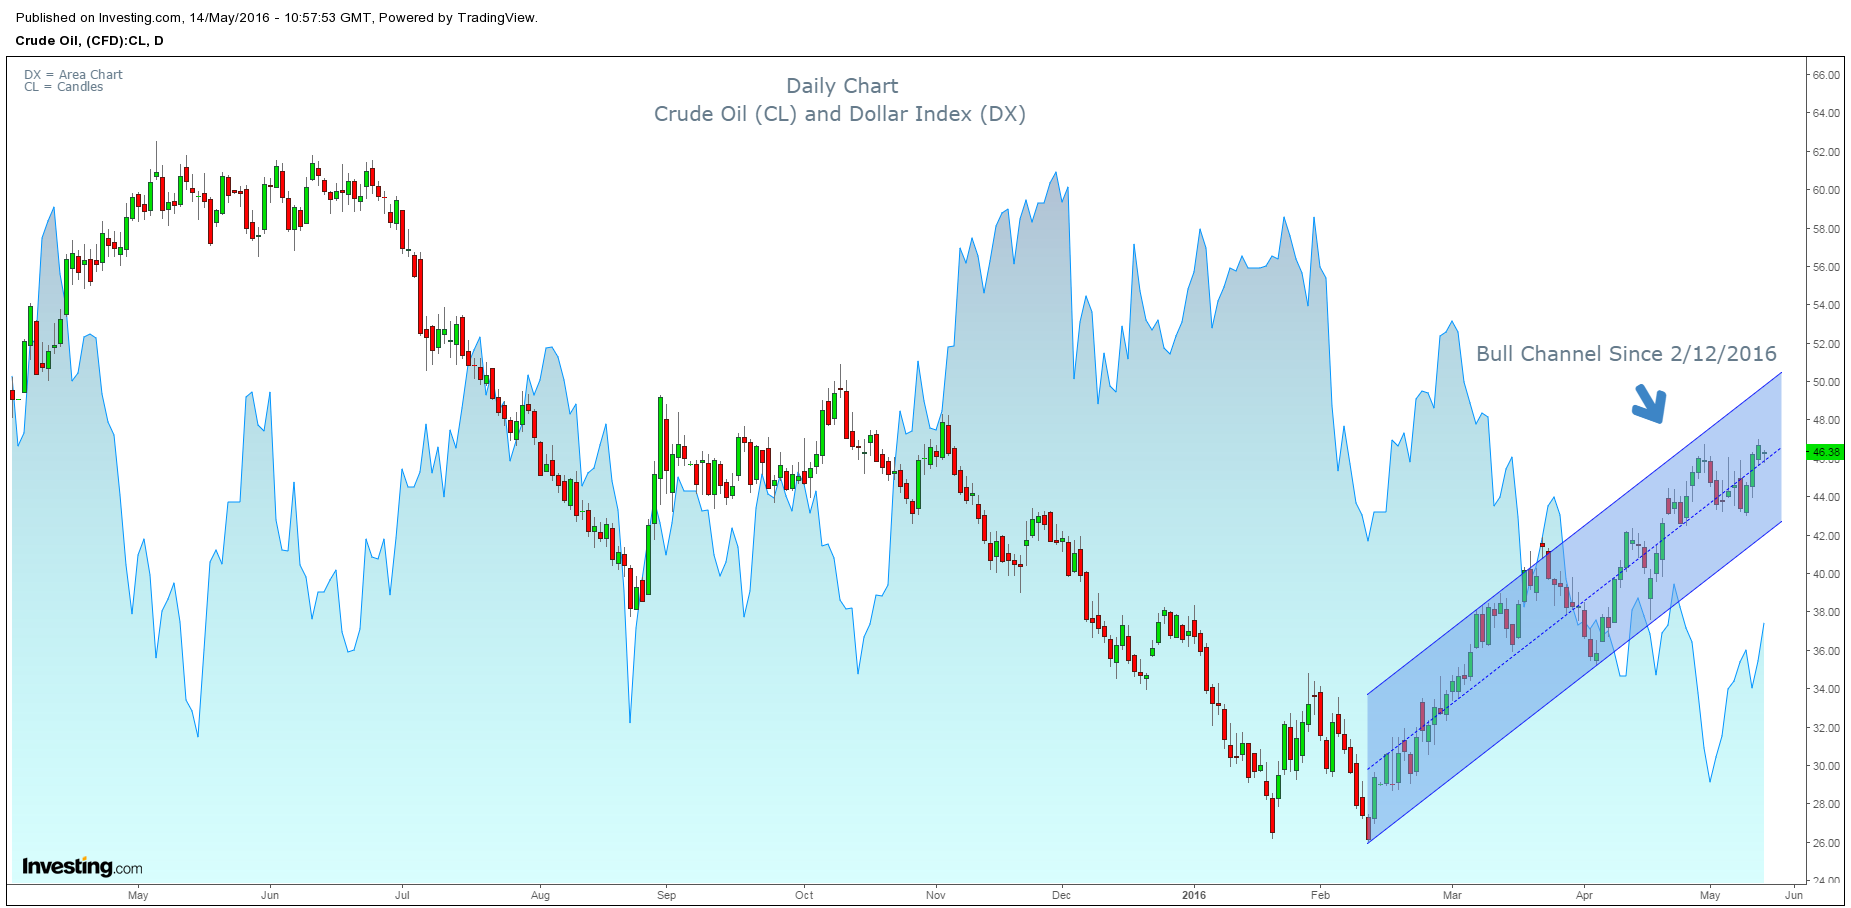
Weekly CL Technical Outlook
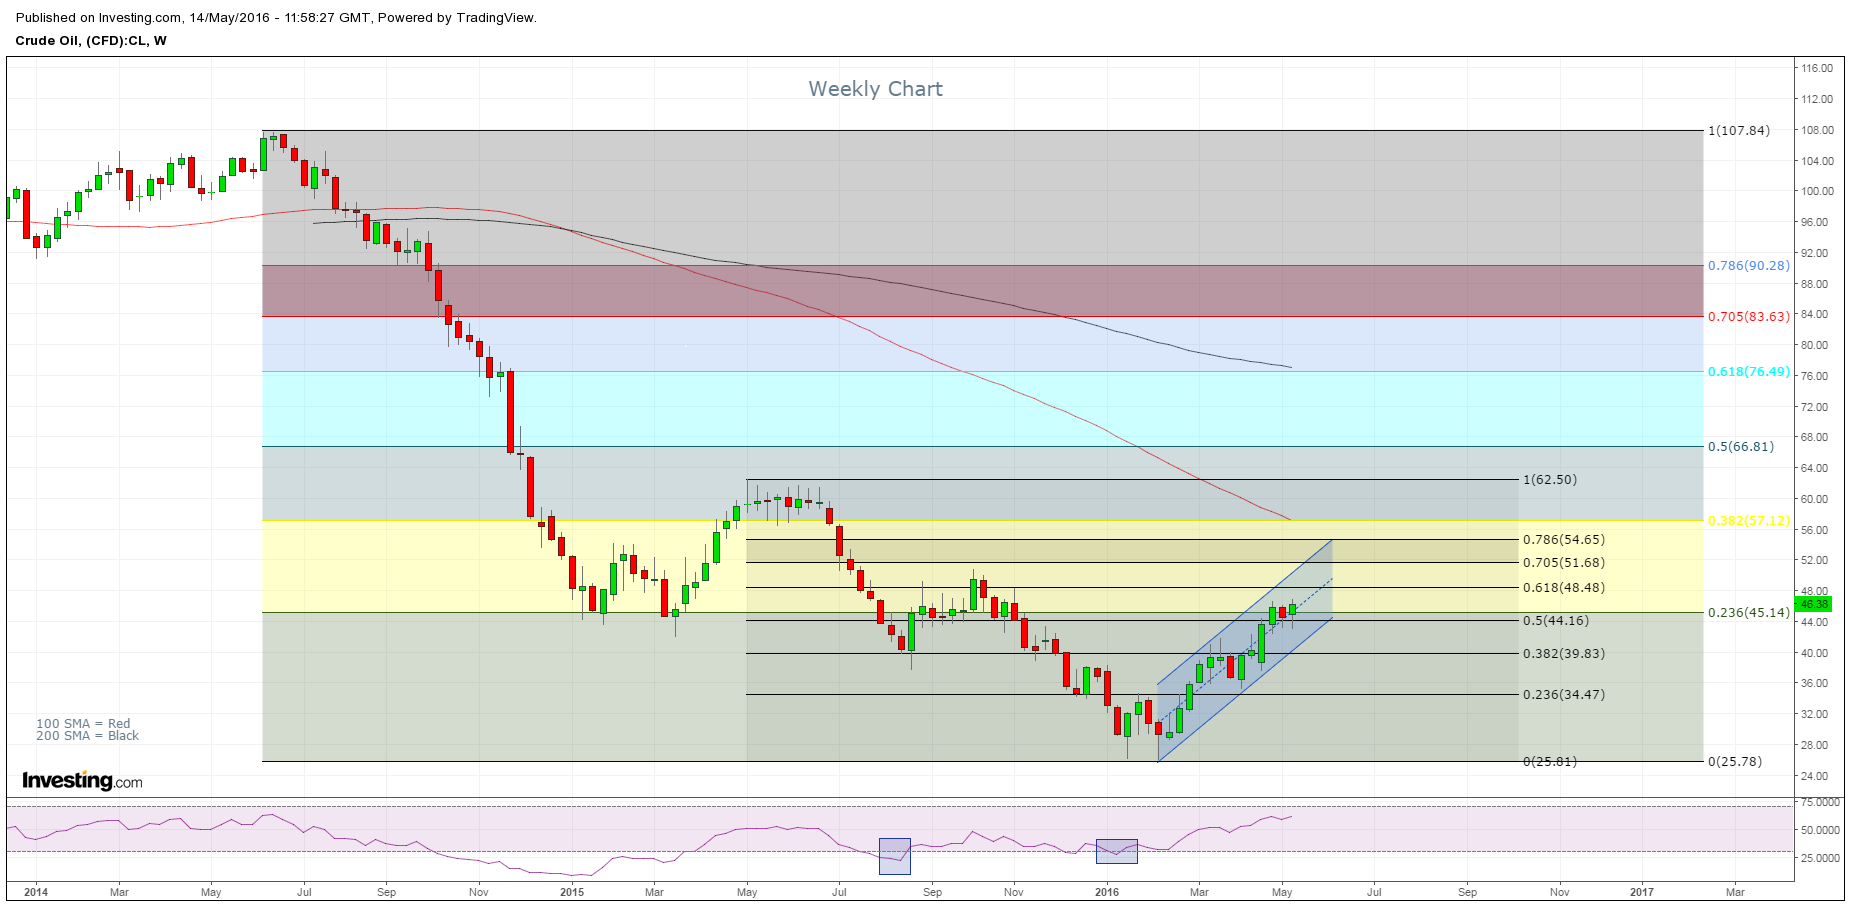
The CL has been on a nice rally since hitting the lows in February 2016. We are at an important retracement zone, having retraced to the 50% zone on the smaller swing and the .236% on the bigger weekly swing. The RSI is nearing overbought conditions and that has been a good prediction for turns on the weekly chart. Having said that, there is still room for a continued rally up to the 100 SMA. Overall Consensus: Bullish
Daily CL Technical Outlook
Crude has been rallying since the lows of February 2016. On the daily chart price action has closed and maintained the rally above the 200 SMA since April 19th. We have entered a resistance band that was last broken in November 2015. This band was a support area and now price action has rallied up to the mid-line. If price continues to rally, the $51 handle is the projected target. Overall Consensus: Bullish
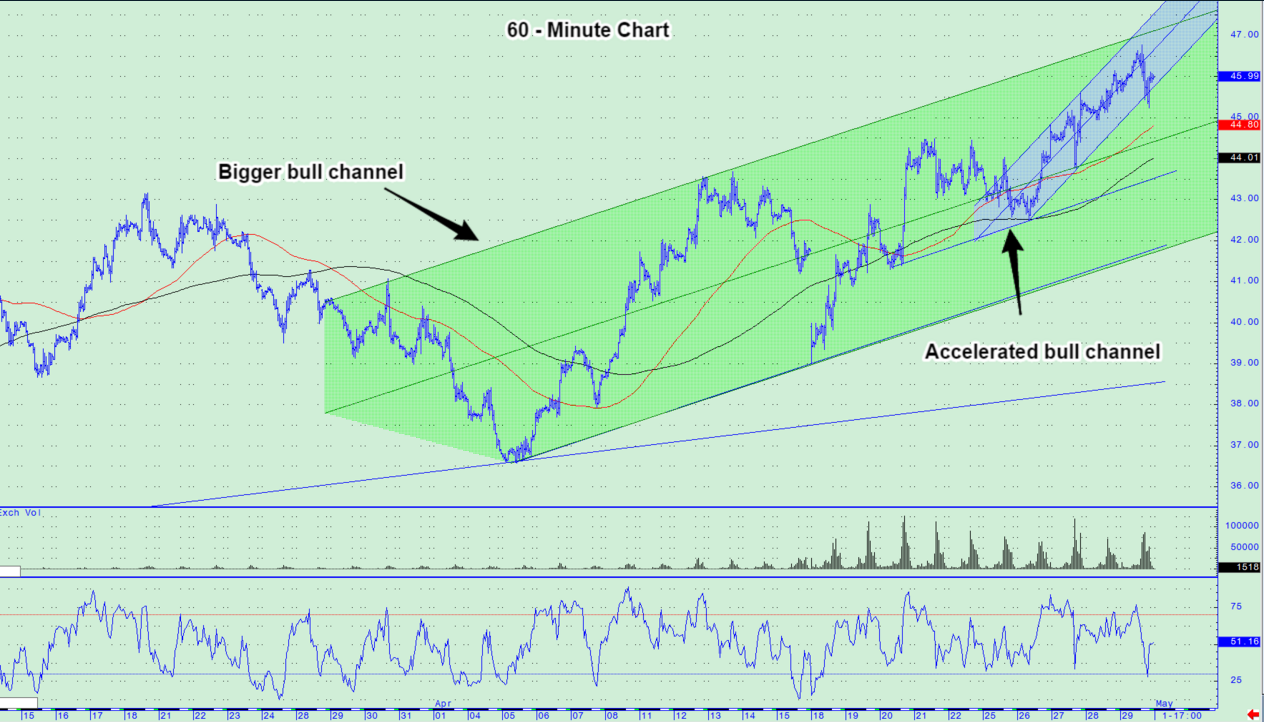
60-Minute CL Technical Outlook
Crude has rallied up and over the consolidation range and continues to trade above the 100 and 200 SMA. The trend line drawn from the lows on April 5th, continue to provide a good SnR point on the charts as price action has begun to rotate around the top of the consolidation range. While I still feel like there is good room for a continued rally, this chart is starting to look as though we are challenging the consolidation range high. Overall Consensus: Bullish with a neutral lean.
15-Minute Technical Outlook
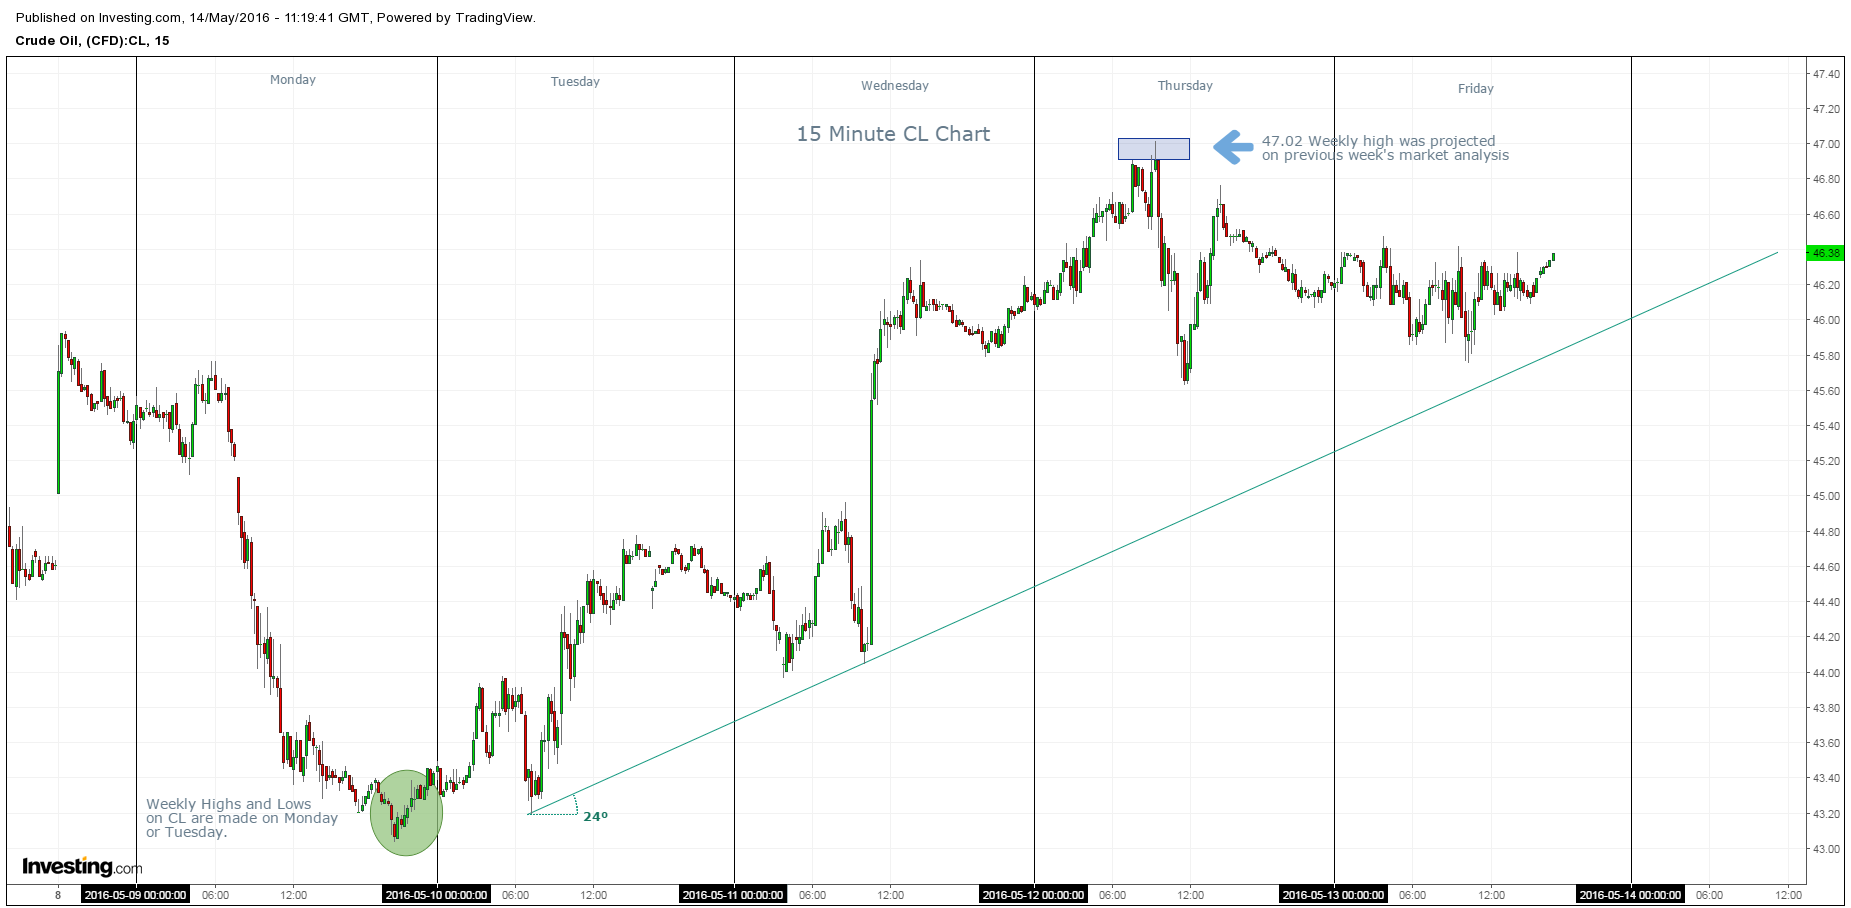
A little “fun fact” about the CL is that the tone for the trading week is generally set on Monday’s or Tuesday’s of any given week. Put another way, watch for the low or high for a given week to be made on that day. In the chart above, the low for the week was made on Monday (May 9th) afternoon. Additionally, as you will recall from last week’s analysis the first level of resistance on your “weekly numbers” was the $47.00 handle. The high for the week was $47.02. This chart continues to show a bullish trend with higher highs and lower lows. However, it is also beginning to show the same consolidation pattern we are seeing on the 60-Minute chart. Overall Consensus: Bullish with a neutral lean.
OTG CL Technical Outlook – Weekly Price Targets
49.20 – 49.75
50.65 – 51.15
53.51 – 54.00
Below the Market
43.45 – 43.95
42.00 – 41.50
40.55 – 40.00

