In October, we posted a forecast that copper futures would make a significant bounce before resuming their trending decline. In March, April and May of this year, price tested the channel line harmonic that we had identified as possible resistance, and it has since fallen away strongly. This suggests that the next downward wave may have begun.
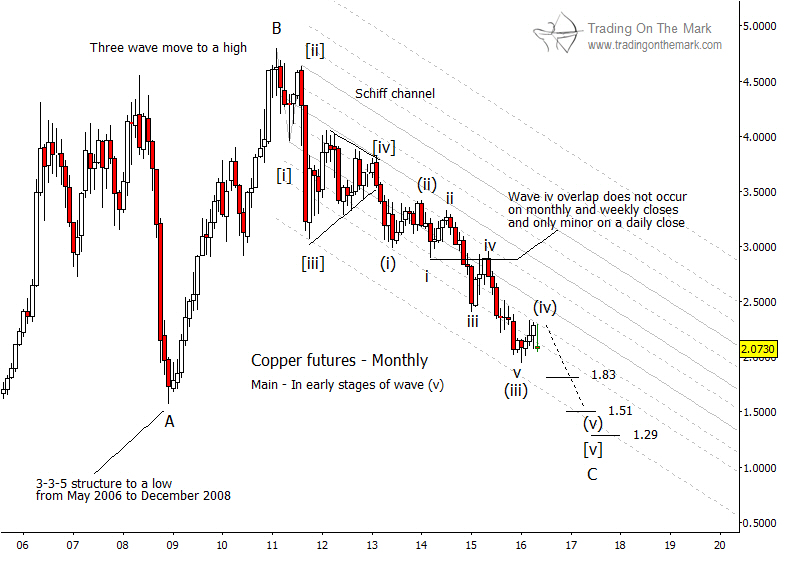
The overall picture is one of a declining five wave move from copper’s 2010 high. Wave [v] in that sequence appears to have extended to include additional swings large enough to show up on a monthly chart. In addition, wave (iii) inside wave [v] appears to have done the same.
Treating the bounce since last autumn as a fourth wave of intermediate magnitude, we now expect prices to decline persistently toward what will become a durable low. Potential target areas for wave (v) of [v] of ‘C’ lie near 1.83, 1.51, and 1.29.
Keep in mind that the chart does not yet offer confirmation that wave (iv) is finished. One possible signal that would confirm the completion of wave (iv) would be the a small bounce from the present area that stops at a lower high. A different confirming scenario might be a decisive break beneath the low we have identified as wave ‘v’ of (iii), followed by a kissback to support, then a renewed decline.
While we favor the idea of prices pushing lower from here, we cannot yet rule out the idea that wave (iv) might become more complex, extending generally sideways for several more months. The general message the chart is sending is to watch for shorting opportunities, but to be selective about them.