The stock market is under distribution, this is a fact. Simply put, professional selling overwhelms the buying and prices head lower. As the markets ebb and flow with the money coming in/out we are constantly reminded about the psychological effects of a bear market. Yes, even after the huge rally off the February lows this could still be considered a bear market. Some of the strongest rallies occur during bear markets, but we cannot dismiss the internal characteristics. Each day we compound and analyze the activity which gives us enormous clues as to the current sentiment and project that onto a future probability, based on prior patterns. But how do we navigate around a market in distribution?
Some of the biggest rallies have occurred in bear markets, likewise some of the most spectacular declines have happened in bull market runs. Therefore, we have to be on our toes and ready if/when a shift in trend happens. You recall the amazing 200 SPX point run in October 2014, followed by a mess of volatility and then a tremendous move a year later, October 2015 of more than 200 SPX 500 points.
Just this past March/April saw an incredible spring of more than 230 SPX points upward after a devastating decline over the first six weeks at the start of 2016. Standing by as an observer one would just marvel at the extreme and extended moves. Yet, opportunity is always right in front of us.
A market under distribution is not difficult to see but certainly a challenge to trade. When institutions are net sellers we find breadth figures slump. The advance/decline (A/D) ratio is one of the more important indicators of market health. A rising line detects participation and sponsorship by the big money players. Publication Investor’s Business Daily grades the SPX 500, Dow Industrials and Nasdaq A/D daily. On a scale of A-F (A being best), they currently score these indices a D – hence a market uptrend under pressure.
A deep dive into accumulation/distribution analysis comes in when grading the quality of an advance or decline each day. A decline on higher volume than the previous day indicates distribution, while a higher volume increase says the market is under accumulation. Now, one or two days of distribution, or institutional selling is not a big deal – markets don’t go straight up every single day.
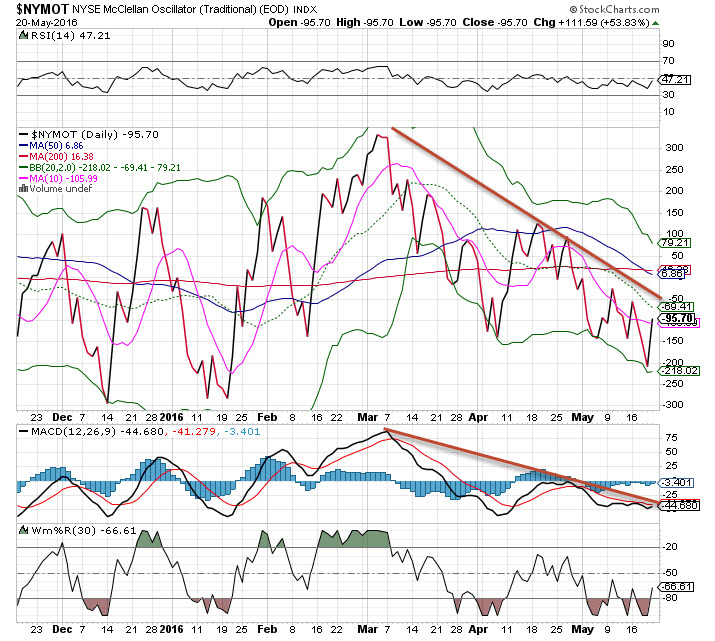
The McClellan Oscillator also gives us a good read on the market’s behavior. When this is heading lower and below the zero line it is also a sign of market distribution or professional selling. This indicator has been trending down and has been in the negative for all of May and making lower highs since the start of March.
All of this data can be seen each day after the close. By taking an objective and non-biased view of the data we can determine how to proceed when certain conditions exist.
However, several of these in a series indicates the institutions are selling, and when that happens investors and traders should not be picking up the pieces – rather, take advantage of the action and go with the trend. If long stocks, that would mean selling some and/or buying some protection using put options, inverse ETF’s or just shorting stocks. Will the condition change? Sure it will, and we should be able to figure it out when it happens but won’t guess when it will occur.