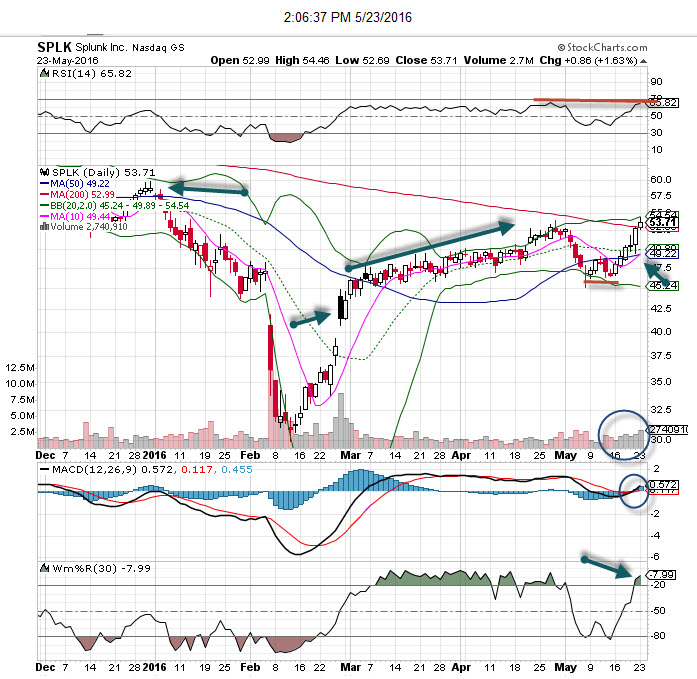
Splunk is one of those highly volatile names that when it trends it can provide some great profit opportunities. As we see from the chart this stock has created a wide range over just the past few months. The gap lower in February seemed devastating but Splunk got its energy back following a strong earnings report a few weeks later. That move left a big gap in the chart and the following weeks saw this stock making higher higher highs, higher lows in a straight line (not much volatility – see the big arrow).
Recently Splunk pulled back to support and put in a higher low on the chart, and now we see the stock trading above the 200 moving average for the first time in many months. The MACD is now on a buy signal and while we see an overbought condition, we should see the stock trade back to the 50 moving average, which would be a good stop to add the position. Volume trends have been very strong and positive.