The Japanese Yen has fallen away from the higher resistance level that we noted for readers here in early April, near 0.009360. If price remains beneath that area, then the Yen should be on track to test or fall beneath the lows of 2015. Such a test could happen later this year, and it may happen again – with lower lows – sometime in 2017.
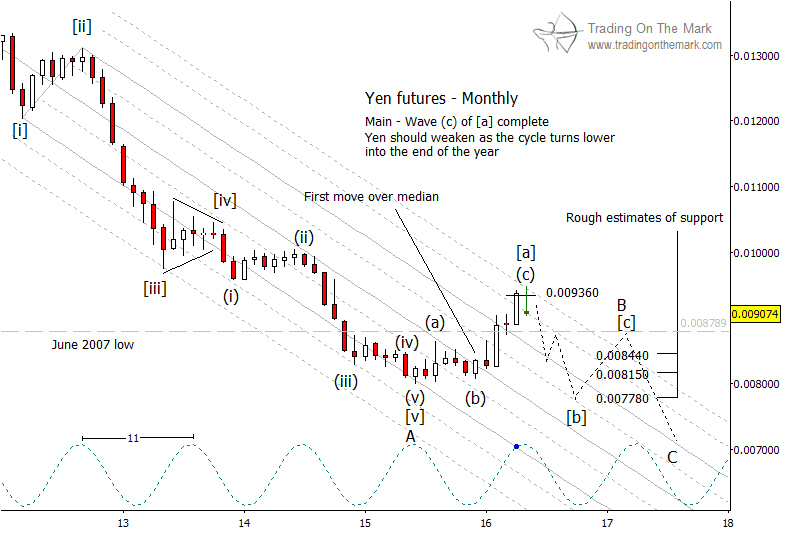
If you have been following the progression of our Elliott wave count, you know we are treating the Yen’s entire decline from its 2011 high as merely the first part of a much larger corrective pattern. So far, the move down has consisted of five waves, labeled [i]-ii]-[iii]-[iv]-[v]. Of those, the fifth wave appears to have extended, forming five smaller sub-waves going into the 2015 low.
Since we do not really believe the Yen is trying to form a gigantic impulse downward, the alternative is to view the decline from 2011 as the part ‘A’ of a sideways/downward correction. If part ‘A’ consisted of five waves, then part ‘B’ typically would consist of three waves, and it might include a substantial amount of overlap. We believe the pattern is currently in the process of tracing wave ‘B’.
Eventually, wave ‘C’ should take price to new lows. However, it may be possible to reach new lows even earlier than that with the next leg of the correction – wave [b] of ‘B’. We have drawn a speculative path on the monthly chart below.
If price continues downward from its present area, then traders might expect the next leg of the decline to continue until one or both of these conditions are met: (1) a test of one of the major harmonics of the downward-sloping channel, and/or (2) price moving into an apparent low at the same time as the trough of the 11-month cycle, or late 2016.
Read about more currency setups in our forthcoming newsletter, coming out next week. You can request your copy via this link.