

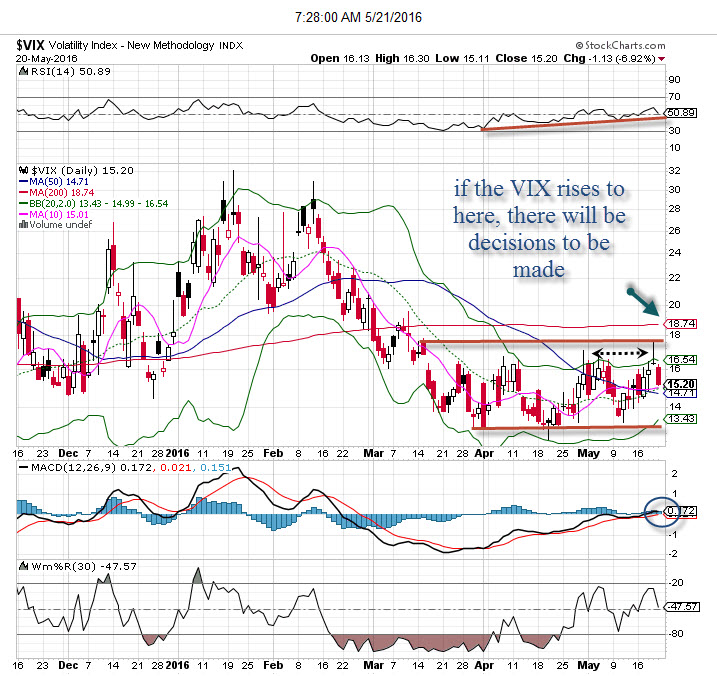
Markets have been under the guise of low volatility as seen in the VIX since this gauge started trending down in early February, and once it broke the 200 ma (see the chart) it has been grinding between 12 and 16.5. That is somewhat normal around this time period, and we have seen spikes in volatility sold off before the end of the trading session (noted on the chart). Usually, low volatility is considered complacent but it is often seen that stocks can rise when the VIX is below resistance areas or not trending higher. In this case, below 17 (which it test on 5/19 but backed down sharply).
Now, one would think that buying some protection (via buying puts, inverse ETF’s or shorting the indices) would be the right thing as sentiment gets even more bullish….but is it? The challenge is to read the tea leaves and come to a conclusion, but right now signals are mixed. Breadth has been rather poor for other a month, a few days here/there are strong numbers. Poll numbers stress the bulls pulling in their horns to a large degree, while put/call ratios have stayed elevated.
With a low VIX, the market is just not expecting enormous moves each day. As the indices have slowly drifted downward from the highs in late April we have witnessed back n’ forth action — up one day, down the next. A choppy environment with little direction but still a stock picker’s market. There have been opportunities with individual names to win with bullish and bearish plays, but trying to catch a market trend with low volatility has been virtually impossible.
Volatility spikes rarely come pre-announced, but certainly if we see this indicator start to trend higher then it’ll be something to be concerned with.
Learn more about Bob’s newsletter at www.explosiveoptions.net He is an in-demand educator and speaker on trading education, speaking to a wide variety of groups on a wide range of educational and trading topics, including technical analysis, options trade selection, and the psychology of trading effectively.

