

Markets put in key levels of support and resistance, which can then be traded if the market revisits the area and the price and volume action are right. We have examples on this recent 5-minute chart of the S&P e-minis.
The previous day sold off strongly, closing on the lows. Yesterday’s low is marked by the dashed green line. It’s a key level. Although the market had traded off this level in the Asian and European sessions (not shown), it returned just prior to the US open. We see this at A where price ventures a little below 2036.75.
As the market opened for US trading, price again came to the key structural level at B, but didn’t go through it, signaling the support was likely to hold. The market was testing to see if sellers are still present.
The market is unable to push through to the downside and sets up a low-risk long. The next bar, C, pushes up. Buyers recognize sellers are weak. They step in and move the market higher.
Volume on these few bars is high. If the high volume were selling, the market would break support and fall lower. The price action together with volume indicates buyers are taking control.
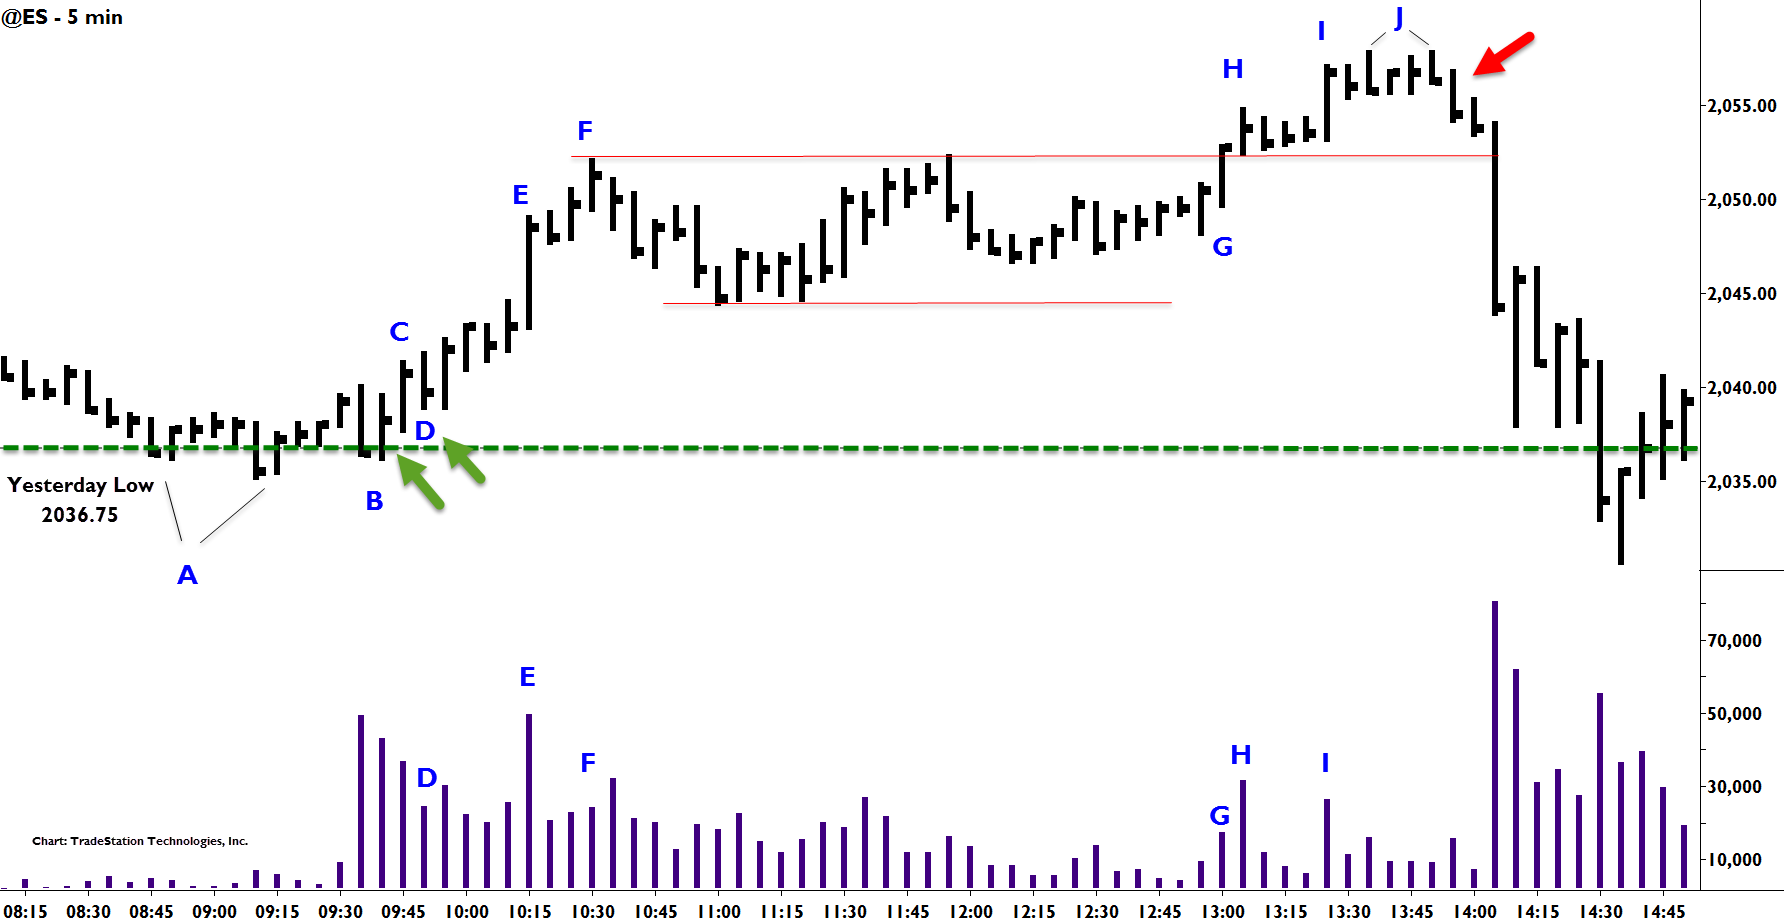
A second entry occurs on D. This is another test. Here the bar dips down, but note that volume is low. This confirms sellers are weak and activates more buying on the next bar.
The market rallies about 10 points and then we see a sudden rush of volume at E. Although the bar is strongly up, the sudden high volume is a warning. Selling could be coming into the market.
The next few bars to F have narrower ranges and lighter volume. It’s time to exit the trade. The buyers may have exhausted themselves in the heavy volume at E as they no longer seem eager or able to aggressively drive the market higher on the bars leading to F. We’ve run about 15 points from the lows – it’s a good rally for the S&Ps.
The market turns sideways for two and one-half hours, before breaking out of the trading range at G. Note the next bar, H. It has high volume, but a very narrow range and a mid-range close. If buyers were in control, price would move higher on bar H. It would have a wide range and firm close. It signifies sellers were holding the market back.
Another high volume up bar occurs at I. We think, perhaps buyers are finally stepping back in, but the subsequent bars prove otherwise. They narrow down, volume drops off, and each time the market attempts to push higher, price reverses. Bars marked J show this.
Remembering that yesterday was a strong down day, we don’t expect today to rally very far. We take a short trade and are immediately rewarded by the sharp break back through the earlier trading range. Such acceleration in price tells us in advance that we can expect to revisit the previous lows. Another nice trade, again informed by market structure.
How price and volume act at key points of market structure such as yesterday’s low or high, prior trading ranges, and trend lines help the skilled trader assess the market and locate trades. Next week, the author will be conducting two free webinars on this topic, and you are invited. To learn more just click here.

