
Fibonacci is HOT! Everyone has heard of it, many top traders use it but maybe you are still not sure what it is, or more importantly how you will use it to make money? I have taught traders for the last 18+ years to use Fibonacci analysis as the main stay of a well rounded trading plan. We began in 1996 doing manual Fibonacci calculation analysis seminars and soon automated our analysis making it easier to implement and released our T3 Fibs ProTrader automated Fibonacci areas in 1999.
I have personally witnessed our Fibonacci Traders, trading from Fibonacci tops or bottoms make some of the very largest trades. I will show you a few examples of how you can easily focus on the low risk high reward trade setups using Fibonacci analysis and more importantly how you can do it with very little Fibonacci experience.
Let’s define the areas we will trade. Fibonacci support and resistance areas are prices where an extremely large cluster of Fibonacci projections and retracements land in a very small window. This can be done manually with several hours of work once you have learned how to master the Fibonacci tool in your trading platform.
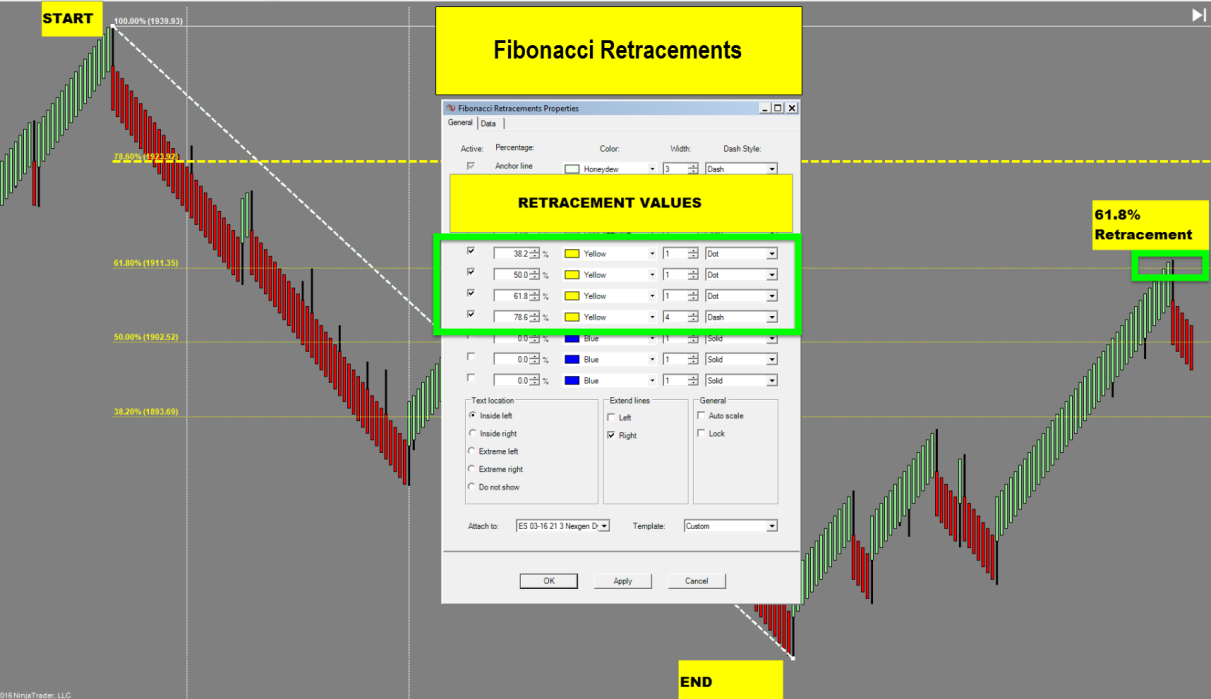
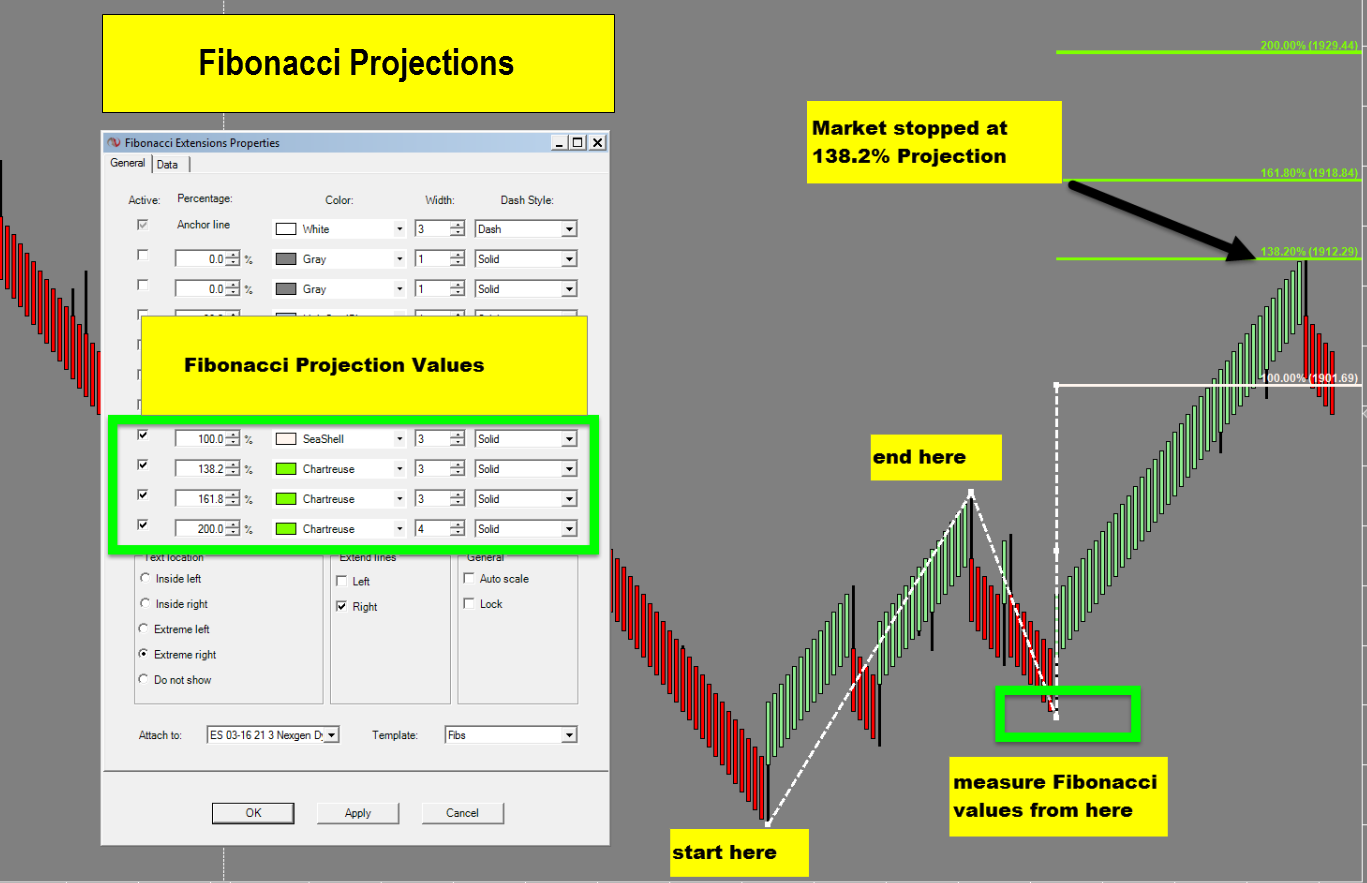
Here are the two key patterns you will need to apply when you’re going through your Fibonacci analysis Fibonacci retracements which measure retracement values from tops and bottoms and Fibonacci projections which measure the strength of the retracement to help determine where the market will stop.
Pattern #1
Pattern #2
Below, I am going to show you our automated Fibonacci software we released in 1999 tht will highlight the key Fibonacci support and resistance zones using 1000’s of projections and retracements. This is the May 31st Crude Oil Futures Chart (figure 1) with our Fibonacci Support and Resistance.
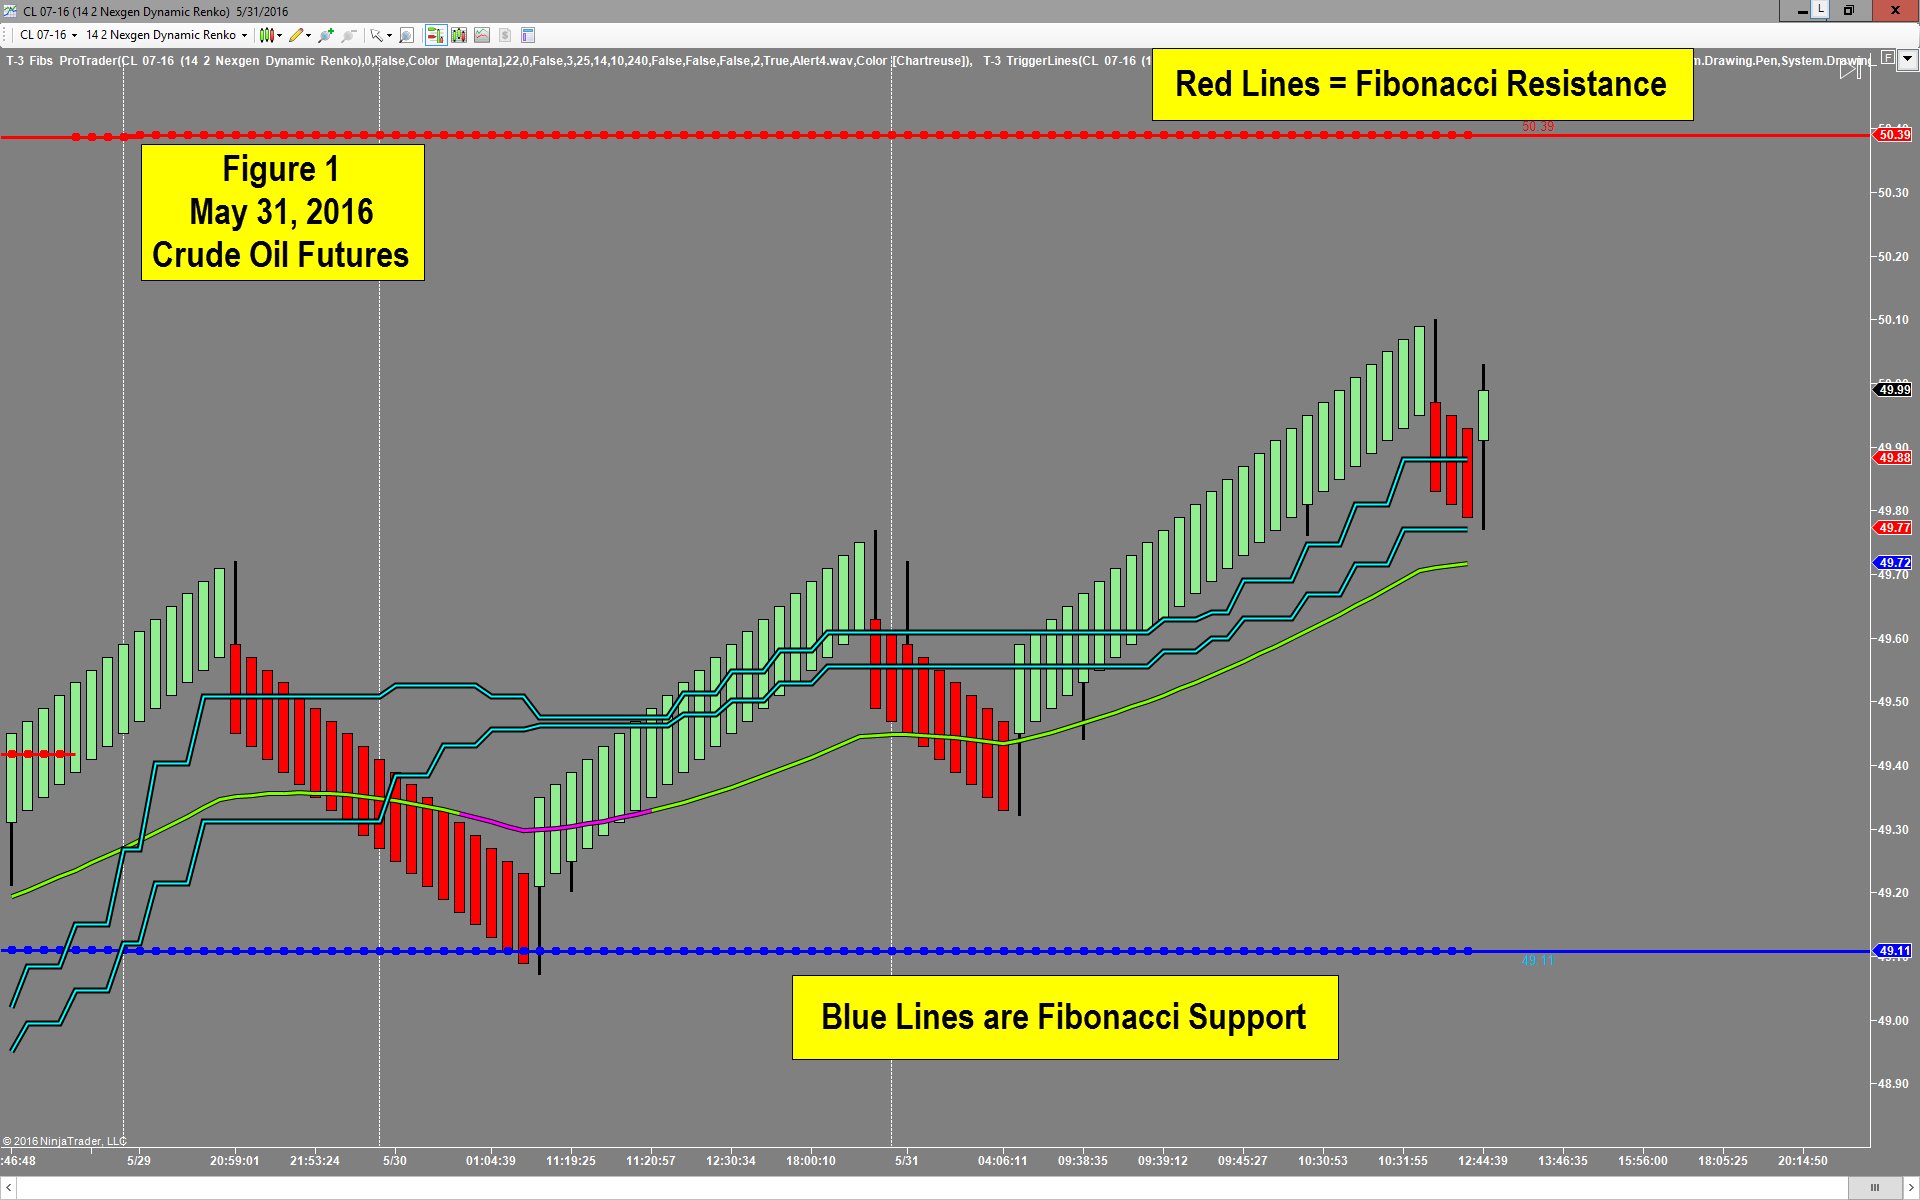
The trading plan we teach is very simple – Buy support when it is expected to hold or sell resistance when it is expected to hold. We use our trigger lines “to determine if the Fibonacci area will hold. In Figure 2 below, you would buy the support area ( in this case 49.11 ) and exit the position at Fibonacci resistance in this case 50.39. This larger chart may take 2-3 days to complete or a matter of hours depending on the speed of the markets.
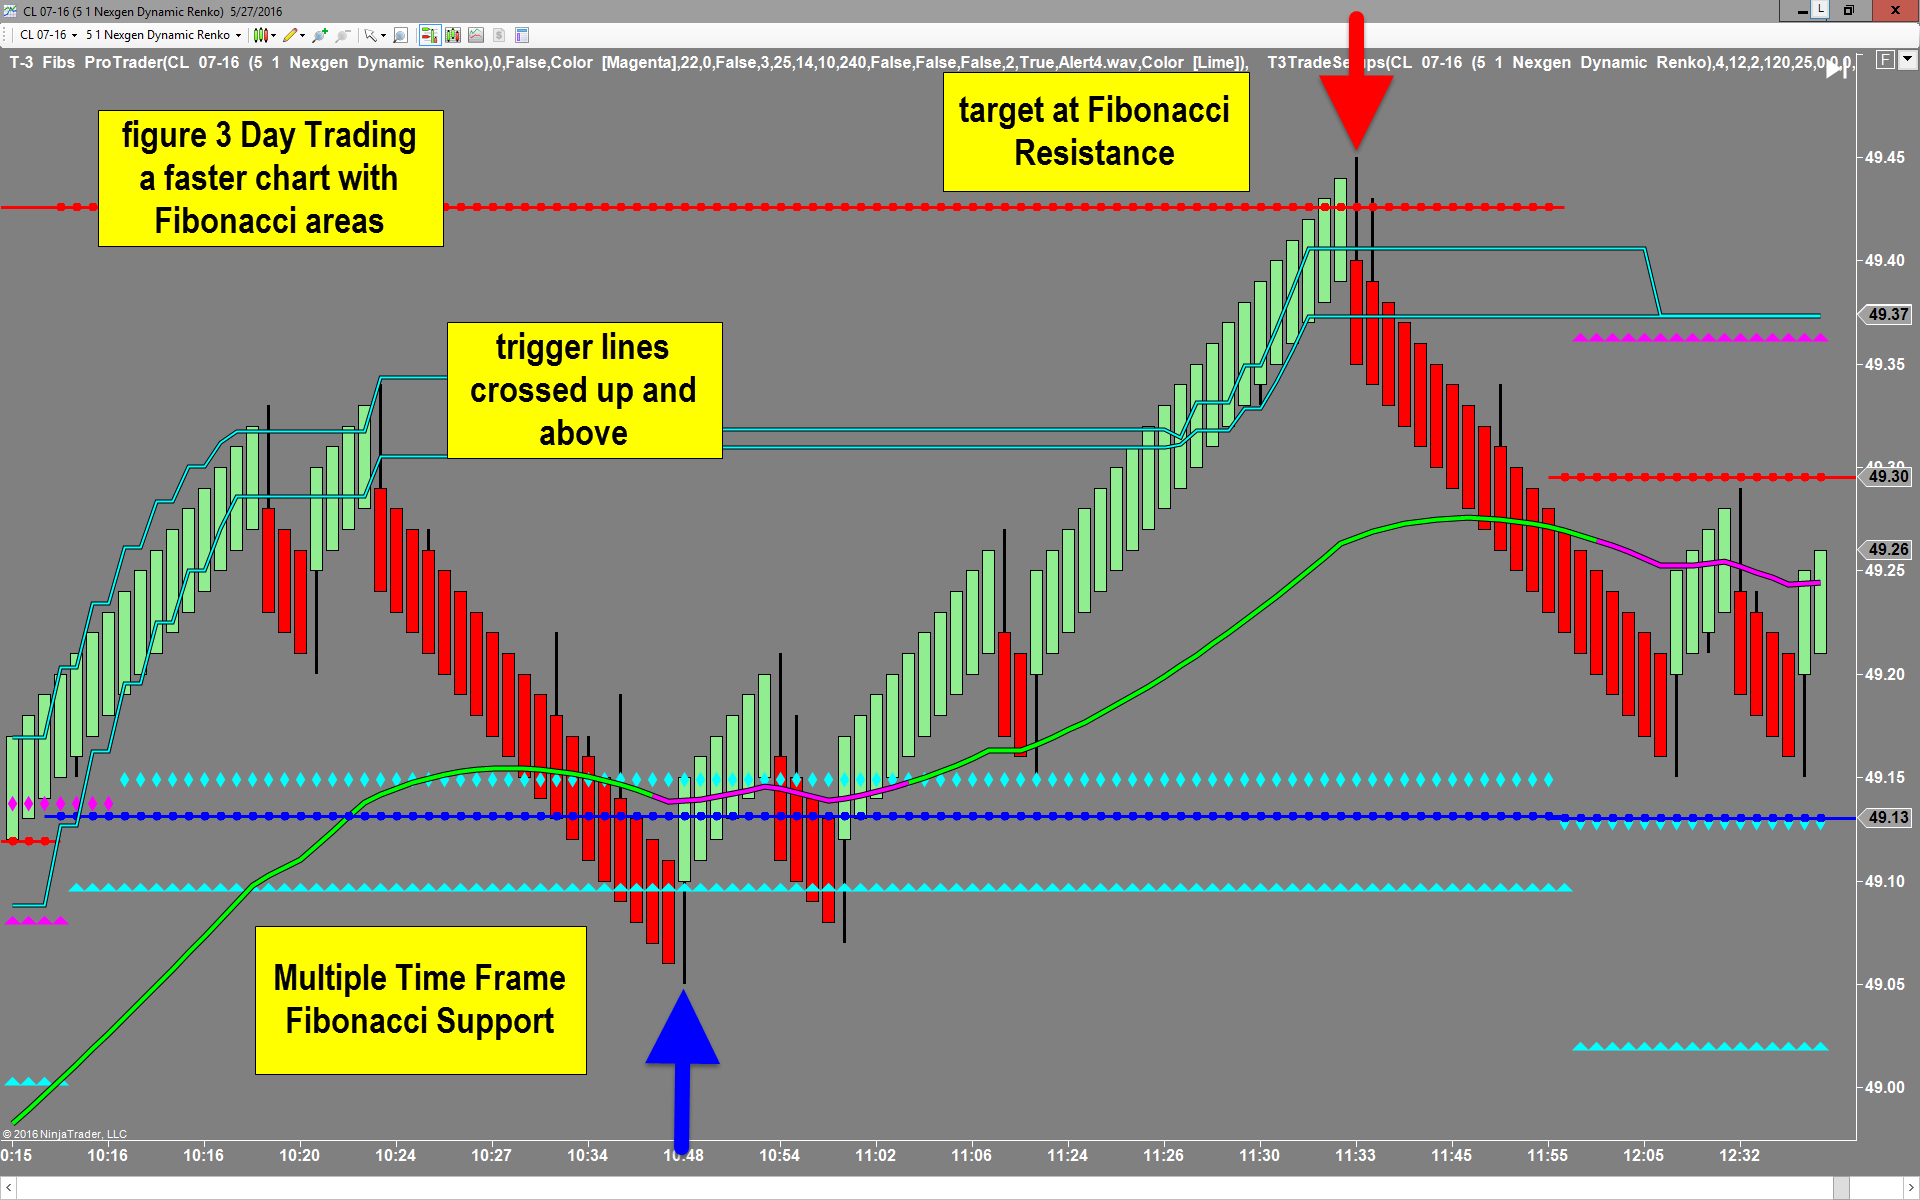
Fibonacci analysis is very powerful for those who wish to trade smaller faster charts and day trade the market.
When you overlap multiple time frames of Fibonacci support and resistance on a single chart, you will end up with very well defined entry and exit areas. Of course the faster your charts, the more you will rely on Fibonacci automation for speed and accuracy.
In figure 3 below, you will notice two cyan lines and one blue line, this represents 3 different charts of Fibonacci Support. At the target you will see 1 red line which represents 3 time frames of Fibonacci resistance.
So the plan is simple, buy at the Multiple Fibonacci Support areas with the triggers crossed up. Exit at Fibonacci resistance for your target
The nice thing is that Fibonacci analysis works on almost every liquid market. Forex, Stocks , Futures and can also be applied to very large charts for the longer term trader or very effectively on smaller charts for the day trader.
Learn to make the old adage of BUY LOW SELL HIGH yours by using Fibonacci analysis to determine tops and bottoms.

