

When we wrote about the German DAX in January, our forecast called for a move lower. The index obliged for a few weeks by making a low near 8726, which was below our initial target areas. However, the downward move did not have follow-through, and that has caused us to reevaluate the Elliott wave count.
While we have been saying consistently that U.S. and European stock indices appear to be in topping patterns, we do not really expect the markets to “crash.” A more likely scenario would be a lengthy decline full of overlapping waves – in other words, a type of downward corrective pattern. In our view, that kind of gradual move would be the best way for equities markets and other markets to reconcile with actual economic conditions.
In the DAX, a downward overlapping pattern eventually could take the index to the 6000 area, which was approximately the vertex of the triangle that the index traced during the decade between 2000 and 2011.
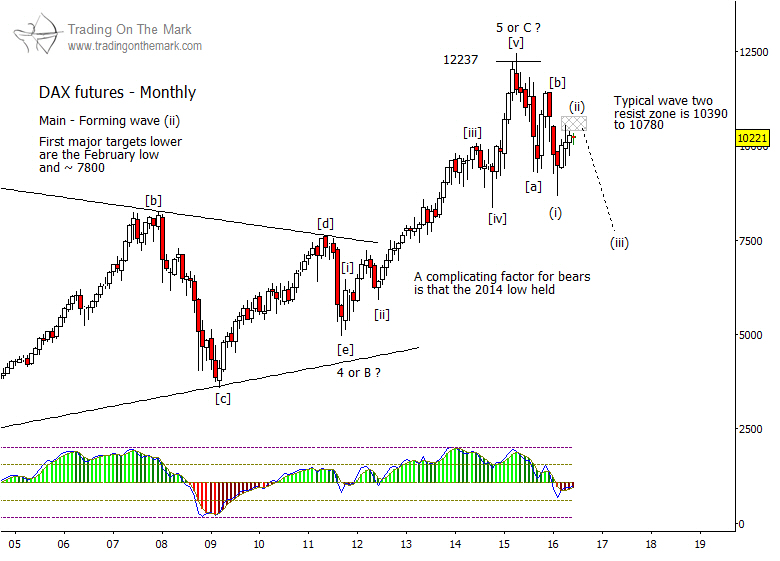
Treating the decline in the DAX as corrective (for now), the best way to interpret the moves of 2014 and 2015 is as waves [a] and [b] of an [a]-[b]-[c] pattern. Wave [c] should be impulsive downward, and price is currently testing an area where sub-wave (ii) of [c] could terminate, near 10390 to 10780. A decline from that target area should reach new lows in sub-wave (iii) and should go even lower in sub-wave (v).
The prospect of a lengthy, overlapping decline means there should be good trades in both directions for years to come. It also sets up an environment ideal for tricking traders into looking for continuation moves when the market actually wants to make a minor reversal. Going forward, it will be important to be relatively quick to take an exit from winning trades and not to allow wins to become losses.
Follow us on Twitter or facebook to get timely market alerts!

