
Are you tired of leaving money on the table by entering and exiting trades at the wrong level?
Fibonacci support and resistance provides traders easy to read buy and sell areas. Any trader who has spent time with Fibonacci analysis knows this. However, most traders lack confidence in their analysis which causes them to not place orders at the appropriate time and price. Nexgen software has solved this problem. In this short article, you will clearly understand how Nexgen Software teaches traders to have 100% confidence selling tops and buying bottoms using Fibonacci and Market Flow analysis.
Nexgen Software Services has provided professional traders automated Fibonacci support and resistance levels since 1999. The T3 Fibs ProTrader software automatically calculates 1000’s of Fibonacci projections and retracements and highlight the highest probability turning points with easy to read support and resistance lines. These Fibonacci levels give you the exact prices on your charts when you will start to look for areas to initiate your trades.
After price reaches a Fibonacci area, the T3 Market Flow indicator highlights the internal buyers versus sellers and high volume areas and show you exactly when the buyers or sellers take over giving you exact points to enter your trades with the absolute least risk and highest reward.
There are dozens of example of this every day on many markets from S&P e-mini futures to stocks and FX markets. I will show you three simple trades from one day. In the following example we will look at one setup from our June 9th chart day trading crude oil futures. In this example your entry never suffered more than $20 dollars of negative open equity and had $400 dollars in profit potential before it turned. First the areas at Fibonacci define the price at which you will look for short trades.
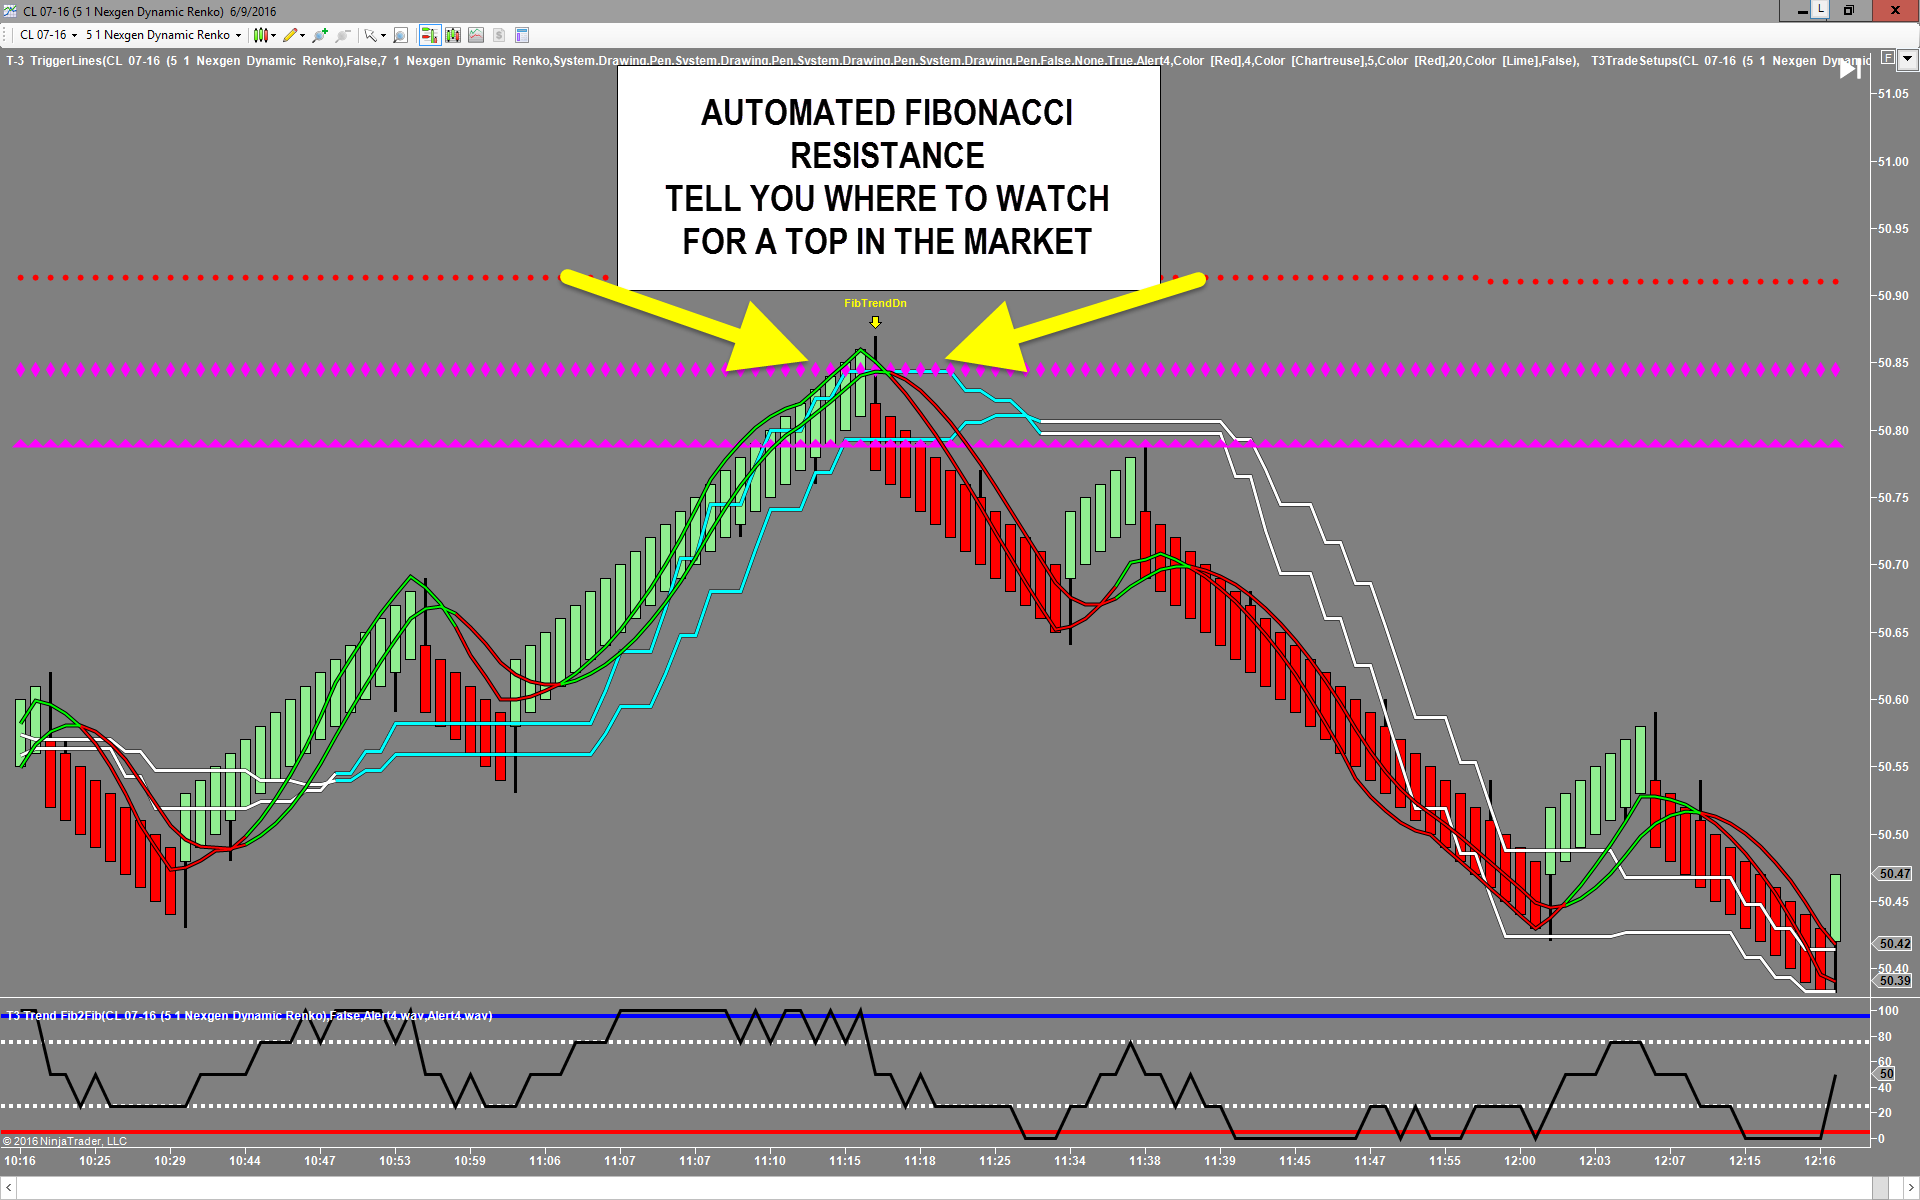
In the above chart you will see the T3 Fibs ProTrader plotted 3 levels of Fibonacci resistance. This is the price on your chars when you start to watch for a top so you can take a short position. Then we will watch the flow of buyers versus sellers at this area to confirm a top and find our entry point.
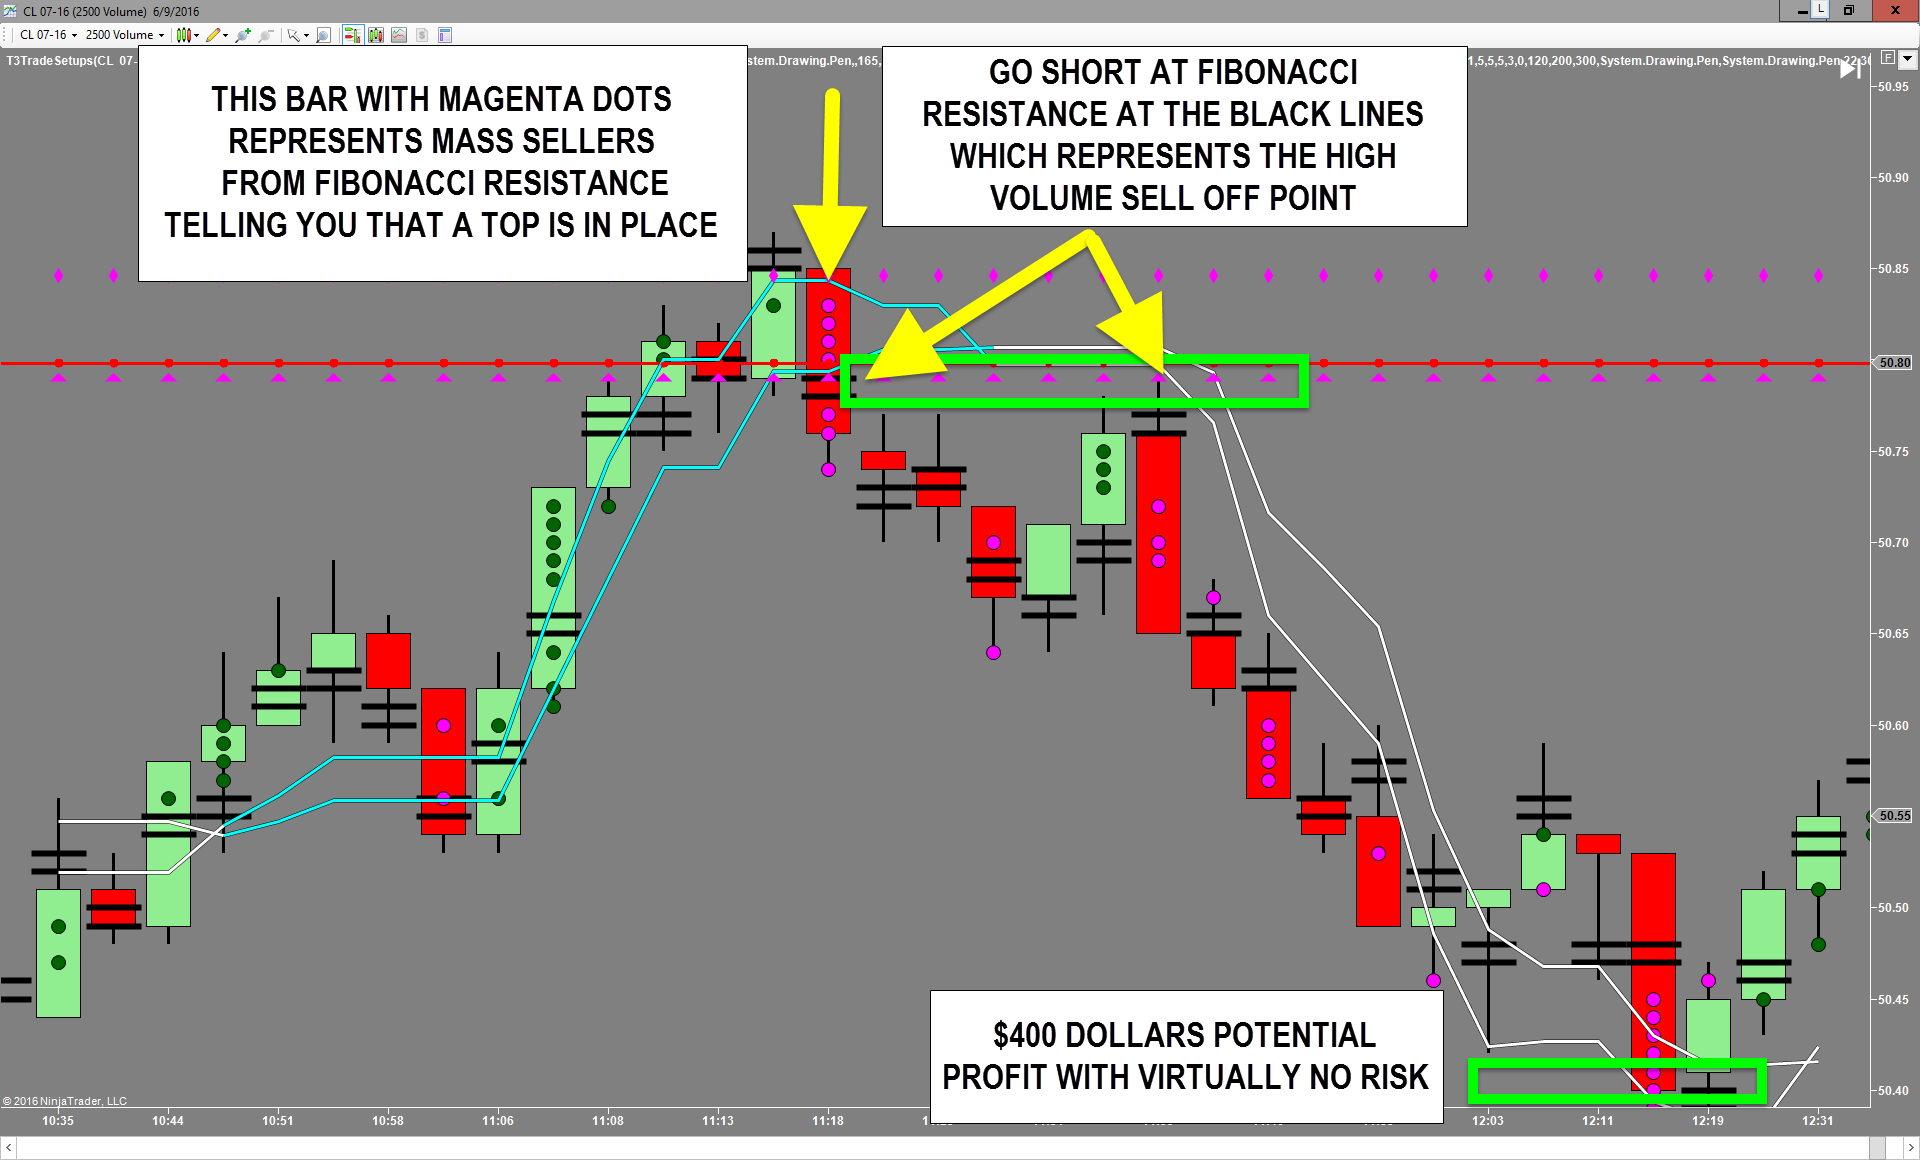
Using a volume chart with the T3 Fibs ProTrader Fibonacci areas and the T3 Market Flow indicator, you will see “what is happening inside the bar “as the sellers take over at the Fibonacci resistance areas creating a reversal in the market. Once you have the reversal in place, your entry is simple, place your limit order to sell short at the Fibonacci resistance that has the “High Volume Area” represented by the black lines in the reversal bar with the magenta dots inside the bar.
This powerful combination of Fibonacci resistance areas that have been in use since 1999 and the addition of Nexgen’s T3 Market Flow indicator give you unprecedented accuracy , and more importantly, unbelievable confidence in your trade setup.
Let’s look at two more trades at Nexgen’s Automated Fibonacci areas on the Eurodollar vs. US dollar futures market June 9th.
First we have to define the “prices “at Fibonacci areas we are looking for a trade setup. Again this is achieved using T3 Fibs ProTrader support and resistance levels.
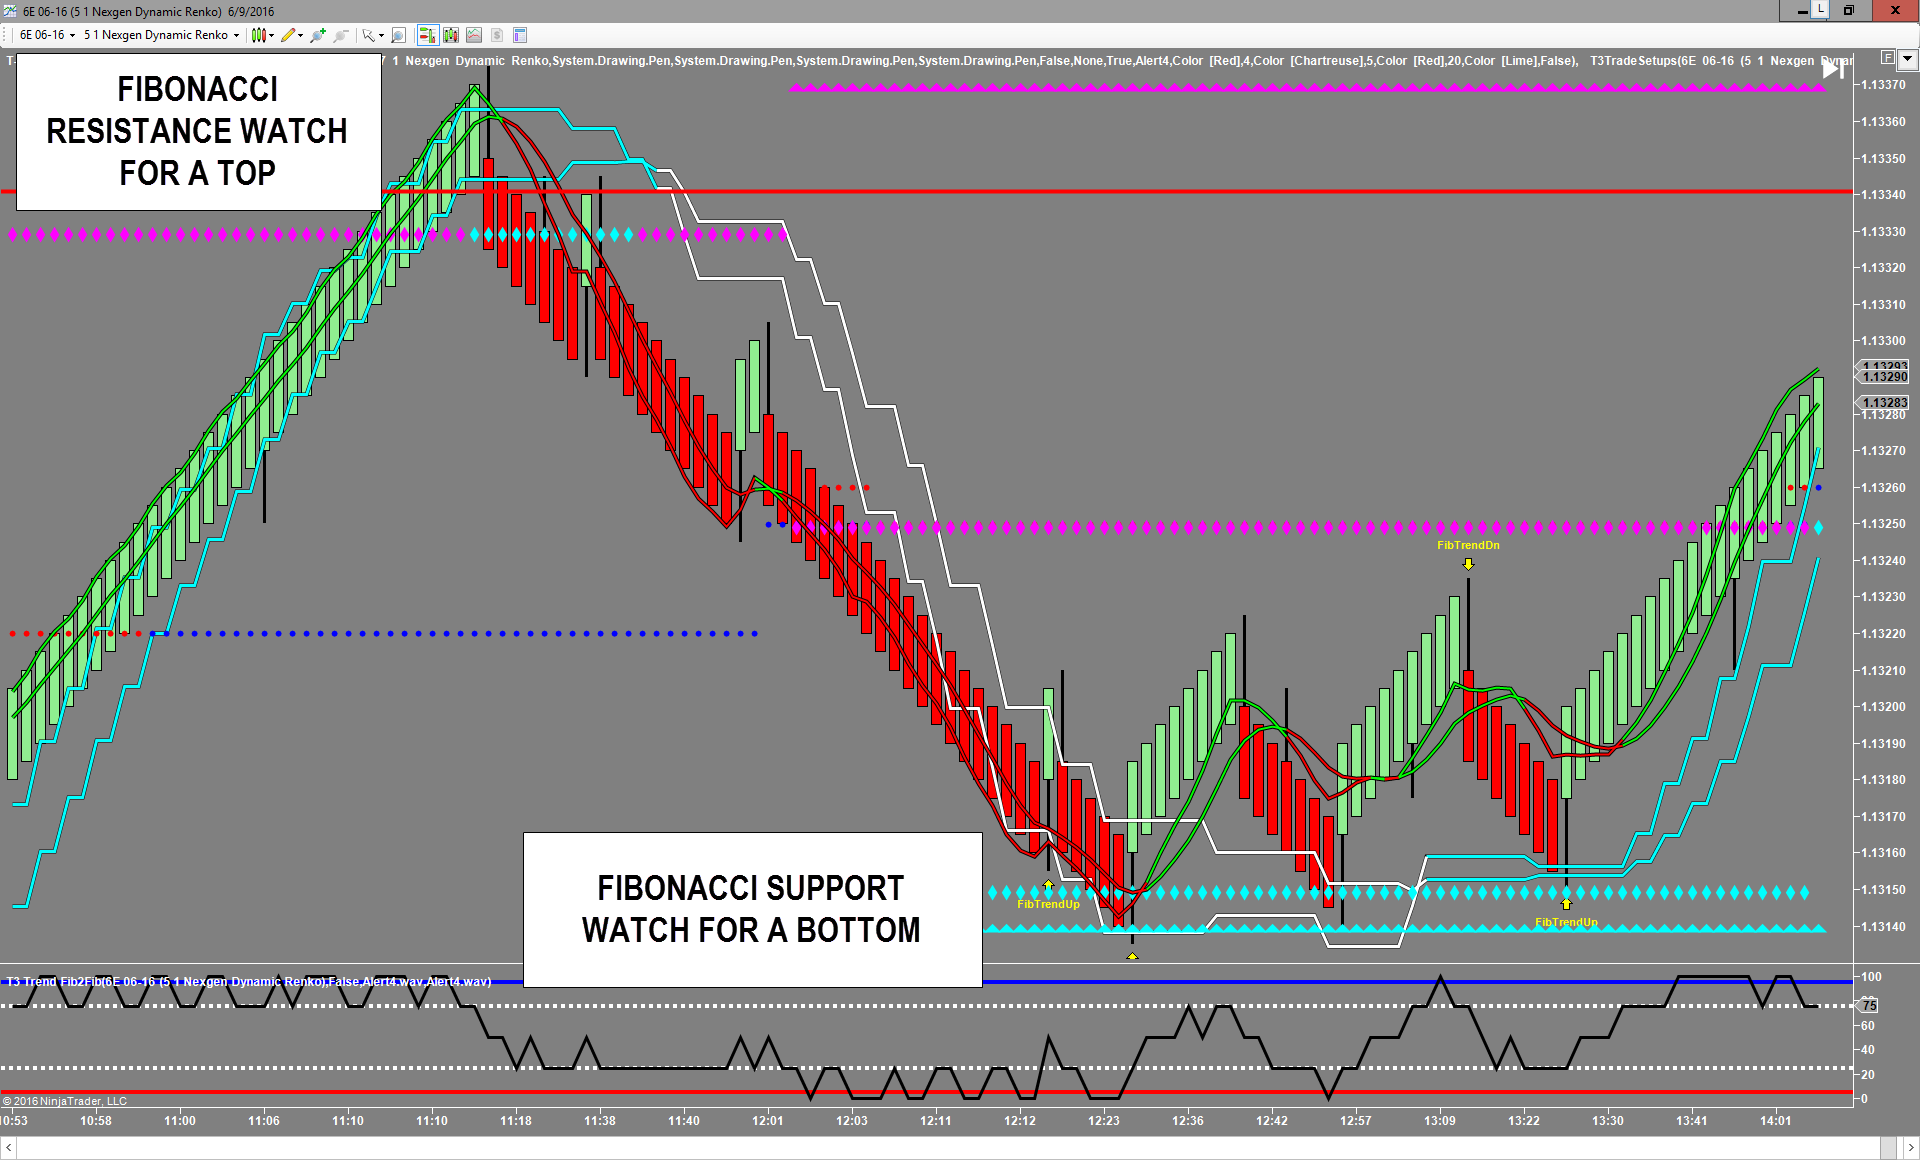
In the above chart, the market reached Fibonacci resistance and then sold off to Fibonacci support. These are the areas we will look for trade entries and to take profits.
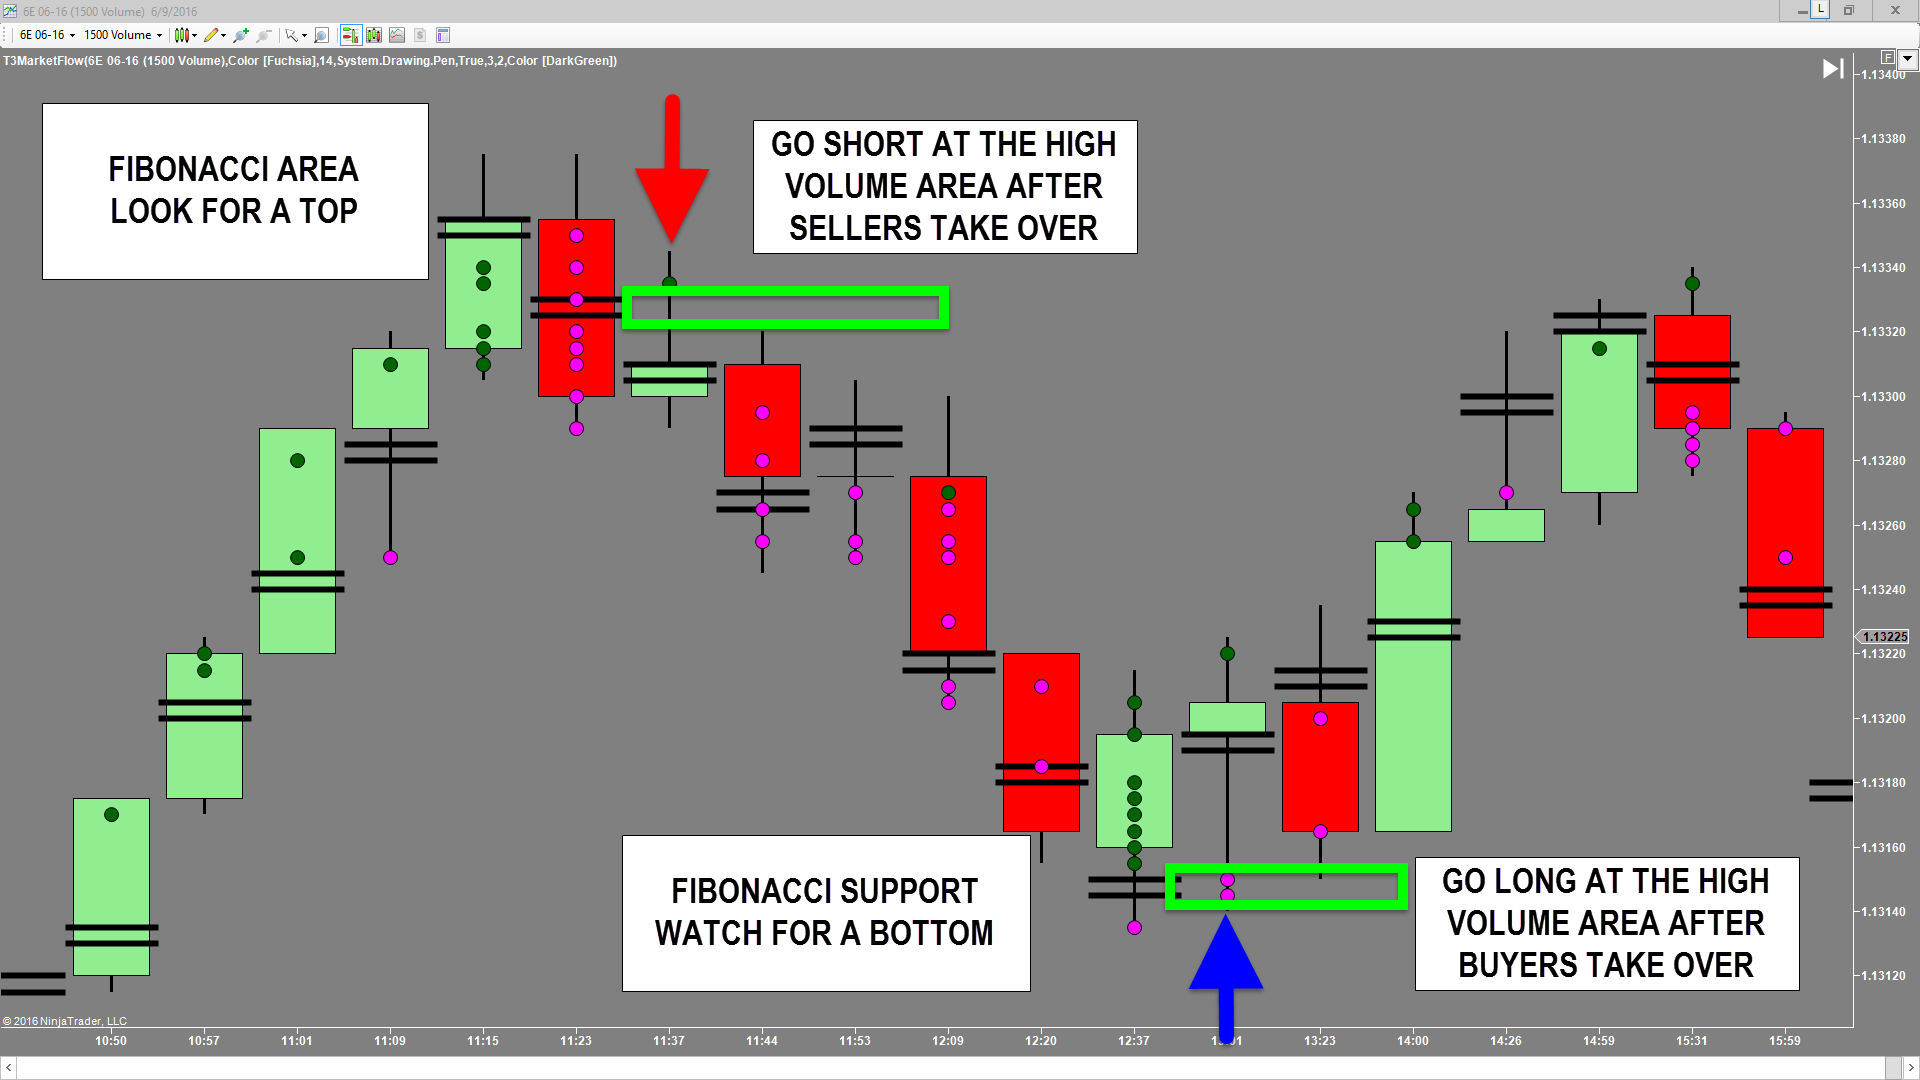
Entry will come when using a volume chart at the T3 Fibs ProTrader Fibonacci areas and the T3 Market Flow indicator, you will see ” what is happening inside the bar ” as the sellers take over at the Fibonacci resistance areas creating a reversal in the market. Once you have the reversal in place, your entry is simple, place your limit order to sell short at High Volume Area” represented by the black lines in the reversal bar with the magenta dots inside of the bar.
The opposite will be true when buying Fibonacci areas, wait for buyers to take over and give you the exact price you are looking for entry and then go long when price hits the “High Volume Area” represented by the black lines in the bar with the green dots inside of the bar.
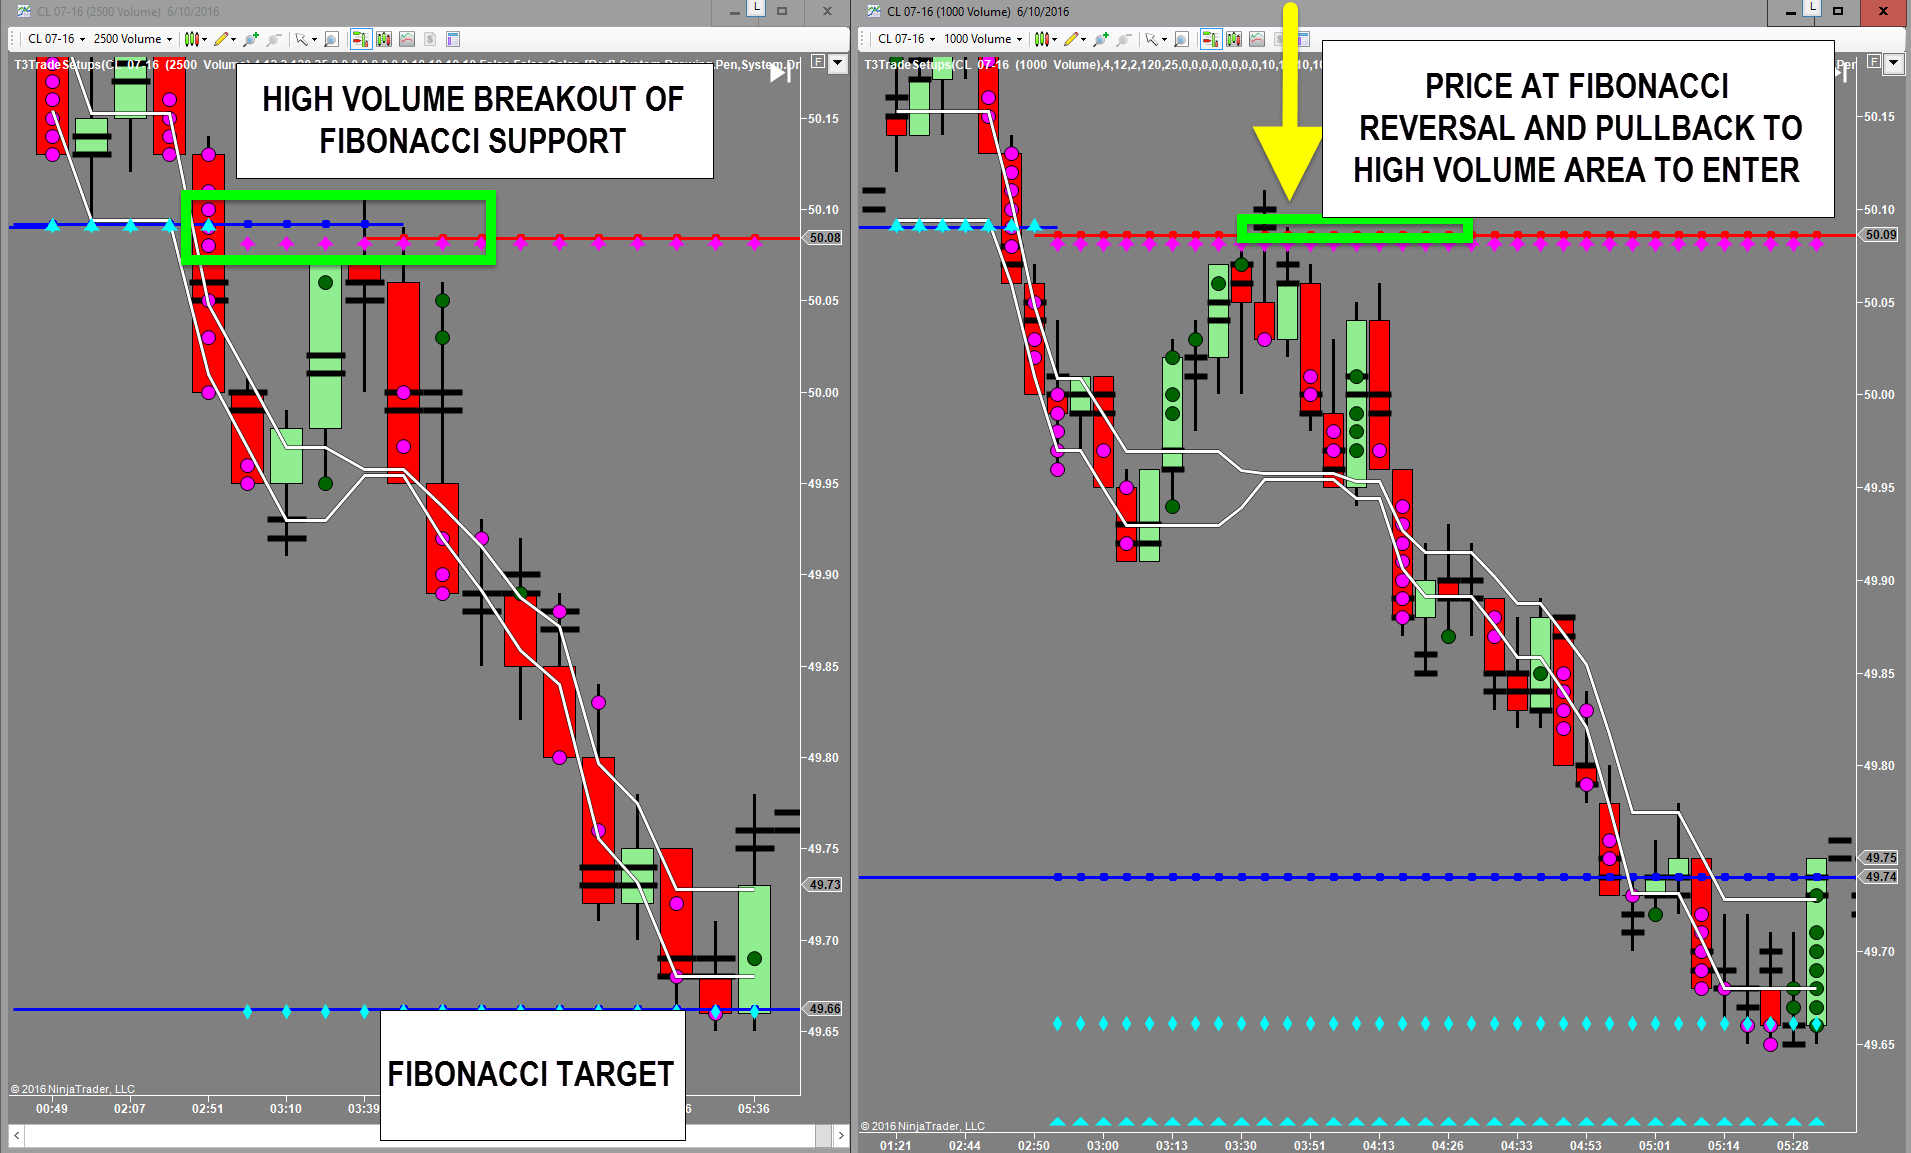
What if the Fibonacci areas do not create a top or bottom? They will all break eventually so we need to be able to see and understand how to take advantage of this situation. Let’s take a look at crude oil from this morning’s market on June 10th.
In the following chart 50.08 was Fibonacci Support that did not cause a reversal. Notice in the chart on the left there was a high volume breakout of this support. The magenta dots, the high volume areas and the pullback to the new Fibonacci resistance give us an area for the short setup. Upon price reaching 50.09 the smaller chart on the right was used for entry. A reversal bar with magenta dot and a pullback to the Fibonacci resistance and “High Volume Area” represented by the black lines in the bar with the green dots inside of the bar. This setup had $50 dollars risk and $420 dollars profit potential at the Fibonacci Support target at 49.66.
Incredible accuracy ,unbelievable confidence makes good traders great and gives new traders the ability to learn a time tested method in a matter of hours.
Nexgen software teaches traders in a live classroom during the trading day how to recognize setups on any market including stocks, futures and the FX markets.
Using Fibonacci support and resistance as a guideline is critically important for understanding the high probability areas for a potential top or bottom in the market or if the market will continue with the trend as we break Fibonacci areas. Understanding exactly when and where to enter your trades using the T3 Market Flow for defining the least risk possible and maximum reward will take your trading to the next level.
If you are serious about making 100% confident trades, and getting the absolute most out of each and every trade, Nexgen Software offers a free 10 day trial of our software, combined with a live class run during a live market environment teaching exactly how you will make trades with the utmost confidence. You will never look at the markets the same way again! Take the time to fill out the form at the top of this page.

