The S&P500, the index of large-cap stocks, made a new high for the year last week, briefly touching 2120 before falling back to close at 2096.07, a couple of points below last week’s close and the close two weeks ago.
The index has been bumping against the high side of a very long and very large consolidation area that extends back about 18 months and covers about 250 points, from roughly 1850 to 2100.
So was that surge to 2120 the break-out we’ve be watching for all this time? Nope. It was a head fake, to lure the unwary into getting back into the long side.
The S&P has done this before, most recently in April and again in November. In the previous attempts, as in this one, the market immediately turned down, as traders took advantage of the move to sell into strength with both hands. In the two previous “break-outs” the immediate retracement was followed by a substantial decline.
Nobody, not even me, knows for sure that will happen again. But until we see some definitive and decisive reason to change our opinion, that’s the way we’re betting, at least for the short term.
The short-term for us is days or weeks. For those interested in a longer time frame, there are ominous signals coming from the Bank of America, in the form of an analysis of how money is moving into and out of various market sectors.
The short answer: money is moving out of equity funds (even as the market flirts with new all-time highs) and into bonds – especially high-yield bond funds – and precious metals. Check the price action on gold and high-yield bonds recently to see what that means.
One interpretation is that the big money is quietly leaving the party, even as the market advances, albeit on slender volume. That leaves unanswered a key question: in these parlous times, who is buying? It better not be your 401(k).
This week
It looks to be a busy week. Most of the speculative activity will revolve around the Fed Open Market Committee meeting and the interest rate announcement Wednesday afternoon. This monthly ritual has devolved into an excuse to push the market price hither and yon, based on the auguries embodied in the commas and semi-colons in the Fed statement.
There will not be a rate increase in June and probably not in July, but there will be the usual scares and alarums as we approach the statement. Just trade the price action; the rest is just fluff for the foolish.
Near the end of the week we’ll run into volatility connected with Quadruple Witching Week, when futures contracts and various options all expire more or less simultaneously. As usual there will be a lot of arm wrestling around the strike prices with the highest open interest. You can see what some of those are in the options newsletter on our blog.
And the vote on Britain’s possible exit from the Eurozone is showing surprising support for getting out; unexpected and frightening for European markets, where the money flow out of equities is even stronger than in the US.
Prognosis: Lots of whipping around, possibly big surges in either direction, perhaps both. But when the dust settles we’re on the short side this week.
Today
We use the S&P500 mini futures (ES) for short-term trading. The ES (September contract) closed at 2087.25 Friday, after reaching a recent high at 2119.75, just one tick above the spike high we predicted in last week’s article.
The last two days of the week were very bearish; the market gapped down Thursday and continued down to close with a slight loss. We expect it will move lower in the early part of the week, a view supported by most of the indicators.
2075 will be a key support level. A failure to hold that level will trigger short-term selling and lead the price down further toward 2060, or lower. There is a possibility we could see 2020 before Wednesday.
Holding above 2075 would result in the ES repeating last Friday’s range move and an attempt to push the price up to test 2105-07 again.
Major support levels: 2065-68.50, 2055-56.50, 2023-20, 2011.50-09
Major resistance levels: 2107.50-05.50, 2119.50-21.50, 2029.50-31.75
Visit Naturus.com to see the outlook for gold, options and the ES in the week ahead. Free.
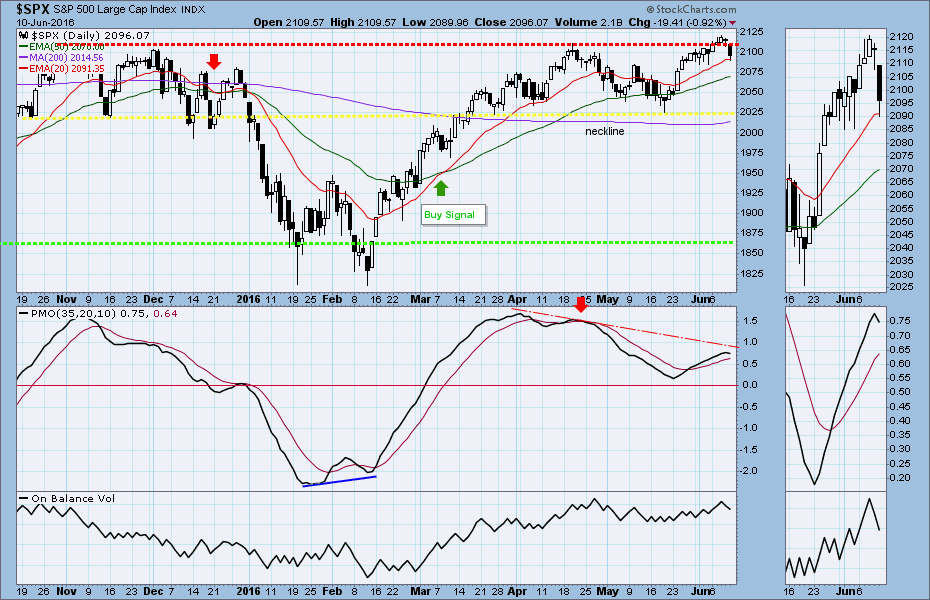
Chart: SPX Daily chart to June 10, 2016