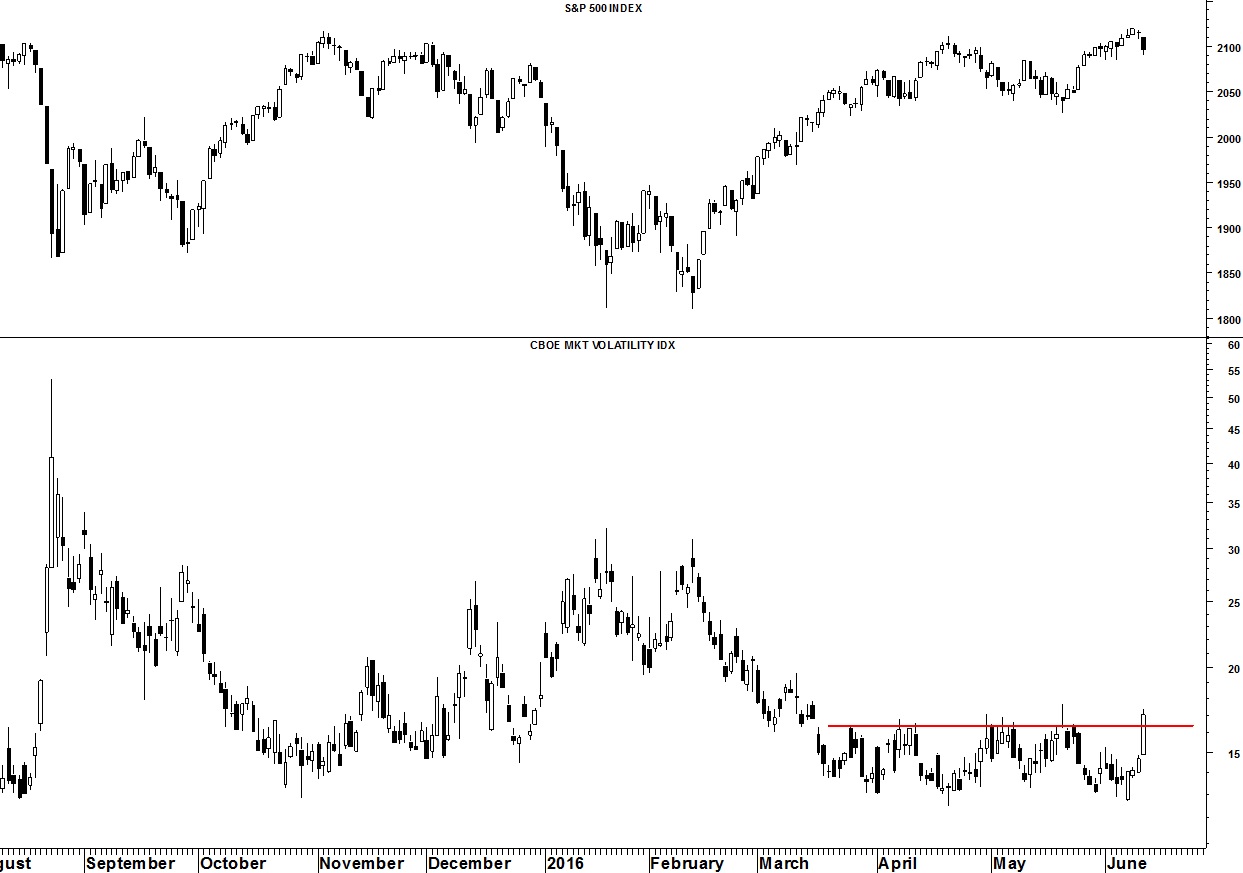
A relief rally doesn’t seem ‘required’ after such a short sell-off but short-term metrics point to a bounce in the immediate future. One of my favorite indicators, the VXV/VIX Ratio, is well into buying territory – so much so (below its lower Bollinger Band) that it will probably require a positive divergence prior to a tradable low. Beware any rally this week as it may be a bull trap!
The CBOE Volatility index (VIX) had its best week since January with a gain of 3.56 points to close at 17.03. Friday’s close left an engulfing bullish candlestick on the daily chart and constitutes a breakout from important resistance at 16.40 (see my May 9 Commentary) which is a level that has been tested on numerous occasions in the past and held. A cycle low is due at the end of this week and is likely to mark the end of the relief rally.
Get your copy of the June Lindsay Report at Seattle Technical Advisors.com


