

Since we last visited the London FTSE in March, the index has worked through a sideways/upward consolidation basically as expected. The correction exceeded our primary resistance level at 6207 but did not quite reach our secondary resistance level at 6558. The subsequent decline has been strong enough to lead us to say that corrective wave [ii] is probably finished, and FTSE is probably now heading downward in wave [iii].
If the index truly is declining in wave [iii], then the decline should be relentless. In that scenario, the next large downward component should be sub-wave (i) of [iii]. Sub-wave (i) might conceivably stop near 5520, but we believe it will probably reach considerably lower. In fact, if the index breaks beneath its February low, then the next major support areas are around 5060 on a monthly chart and 4952 on a weekly chart. Again, a strong move like that would be consistent with the idea of the first sub-wave in a larger wave [iii].
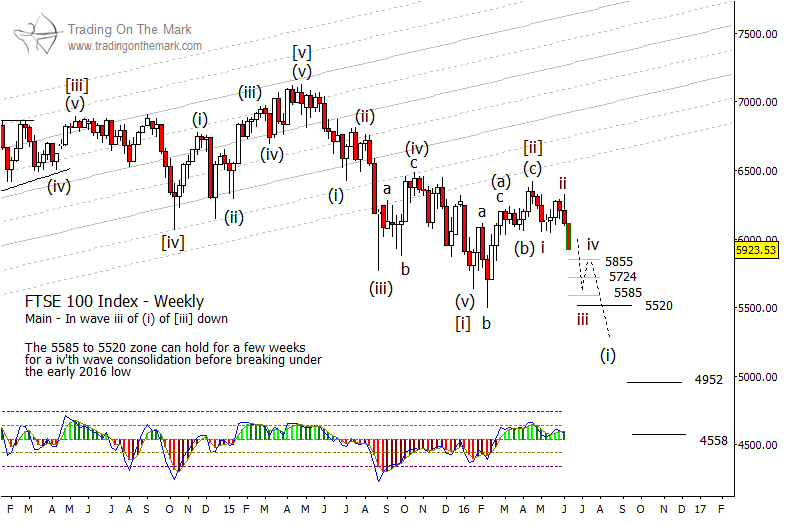
On a faster time frame, traders might view this week’s negative action as part of sub-sub-wave iii inside sub-wave (i). The micro support levels near 5855, 5724 and 5585 should act as stepping stones as price works its way through small waves iii, iv and v to reach the eventual target for (i).
Regardless of its outcome, next week’s Brexit vote might cause the index to ricochet among the nearby levels shown on the chart. If our main scenario is working, then those moves should trace a series of lower highs on a weekly time frame. On the other hand, if the index climbs above 6323, then we will have to reassess the pattern.
Follow us on Twitter or facebook to get timely market alerts!

