

Recently, world stock markets fell sharply on the news that Great Britain would leave the European Union. When the news is bad and the markets respond by selling off, it can lead to a large decline and sometimes to a bear market. The Brexit sell-off didn’t last, however.
Was there a way to tell that the market would rally? And, since the market recovered quickly after bad news, does that indicate anything for the future? The answers are yes and yes. We’ll take each in turn.
How did we know the market would rally?
The day of the Brexit Sell-off is marked on the S&P futures (ES) daily chart. This day stands out because it was the largest declining day since the August 2015 slide. It also generated huge volume. Typically, such a day would signal the beginning of a larger reaction.
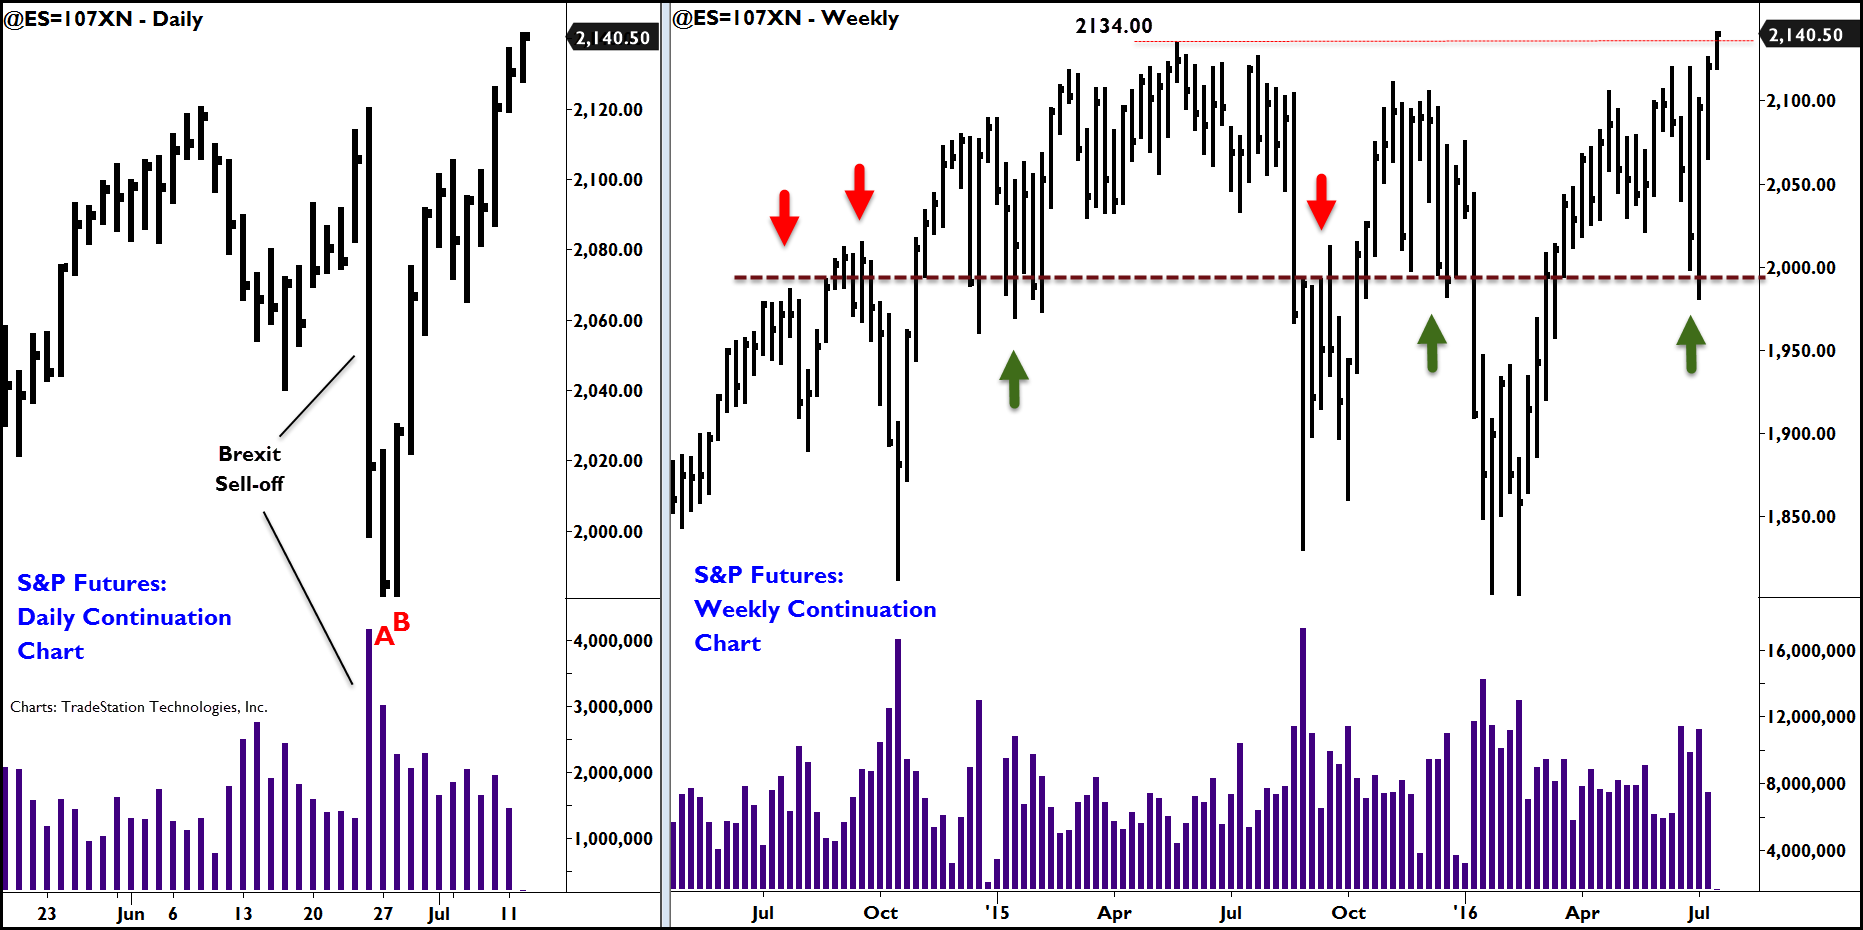
The next day (labeled “A”) was also down and also drew out large volume but look at the difference between it and the Brexit day. The range of bar A is only one-third the range of the prior day. Volume remained very high (almost 80% of the previous day’s volume) and yet the market didn’t continue the heavy slide down seen on the prior day.
This combination of sustained heavy volume coupled with a narrowed range after a big sell-off is significant. It indicates buyers were stepping in and stopping the downdraft. The next day (bar B) and subsequent days confirm buyers regained control of the market.
Why did the market stop in this area?
Although there were good indications from price and volume that the market was seeking to stabilize at A and B, it’s only when we look at the larger picture that the market action becomes clear.
The dashed line on the weekly chart at the 2000 level shows the market trading around this area numerous times since 2014. The area became resistance during the summer and fall of 2014, then support in December 2014 and the early months of 2015 (depicted by red & green arrows). In the August 2015 sell-off, the market knifed down through the 2000 area, and on the subsequent rally into September, found it to be resistance,
The market rallied through the level in October 2015, where it then became support in November and December. That support couldn’t hold and the market went to test the lows of October 2014 and August 2015 before heading up once again.
You can see how important the 2000 level was. It repeatedly served as either resistance or support during the previous two years. It gave us a vital “Head’s up” to the coming rally when price and volume showed buying entering the market once again at the 2000 level.
What does Brexit really mean?
The S&P futures are poised to push up into new highs. Last year’s (May 2015) all-time high is about to be broken.
Only a short while ago, the news was bad. Great Britain made an historic decision, and no market commentator saw it as positive. Yet the market rallied. The Brexit sell-off turned into an ordinary shake out. Weaker traders were “shaken out” of their holdings, being forced to sell as the market fell. Stronger players used the bad news to eagerly buy those offerings (as seen in the price and volume) at a key market level. When the market disregards bad news, it is a strong indication it has higher to go.
As we break into new high ground, no one knows how far the market might travel. The ability to read price and volume will be a key skill as we observe how the market responds to breaking through the all-time highs.
We will be watching how the market trades carefully. We will discuss it as it unfolds on TraderPlanet.com and on the author’s blog, which has many articles like this on reading the market buy its own actions. There are free resources available on price and volume and other important trading topics. You are invited to access them by clicking here.

