

As of 7/13, Equity ETFs posted +$14.3B in inflows over 5 days. This is the largest weekly inflow in 2016. The first half of 2016 Equity ETFs have only attracted $9.7B in assets, meaning before this week, equity ETFs actually saw outflows in 2016. Note other non-traditional areas in ETFs have seen sizable gains. For example, GLD, SPDR Gold Shares ETF, has attracted the most assets of any ETF ytd at $14.0B.
How can one interpret ETF flows? Most of the time there is a one for one relationship, especially when there is little noise. In the case of GLD, the majority of owners of GLD are long only investors and are not using GLD for shorting (so outstanding shares are not being created to lend). Take a look at the chart below of GLD vs its outstanding shares. As investors buy large quantities of GLD, the outstanding shares rise, and so does the price.
GLD price vs outstanding shares (investment)
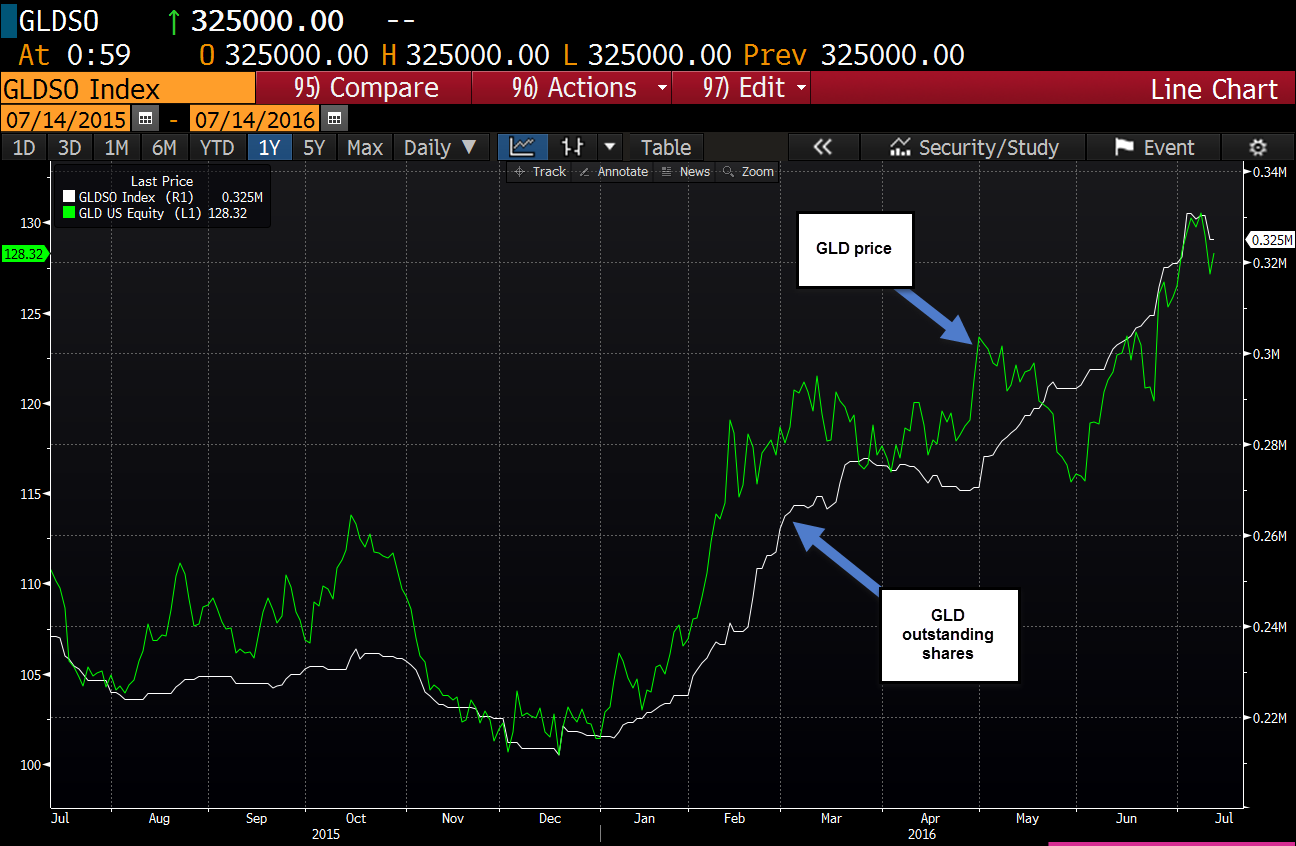
Source: Bloomberg
What can this week’s record Equity ETF inflows tell us about the move this week in the stock market? Well, it’s straightforward. Money has come off the sidelines and contributed to the break out in equities. So, is this week’s huge equity inflows an anomaly or is there more behind it? Let’s take a look at where the money has shifted in the first half of 2016.
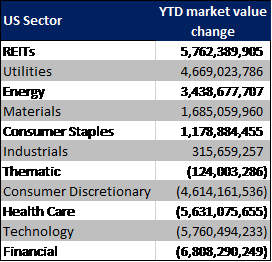
In equities, defensive sectors have attracted the lion share of assets. In 2016, REIT ETFs have added the most assets at +$5.7B, and Utilities are next, which have added +$4.7B in investment. When you factor in multi sector ETFs like USMV, the iShares Edge MSCI Min Vol USA ETF, (contains 12% REITs, 8% utilities) which has added +$7.2B in assets this year, the defensive sectors have added colossal size. Meanwhile, more Risk on sectors have actually seen large outflows, see the table below.
Here are ETF sector flows so far in 2016:
Considering that before this week of inflows, equity ETFs actually lost assets in 2016, so there may be a decent amount of cash still on the sidelines or in short term bonds. The BSV ETF, Vanguard Short-Term Bond ETF, has sizable assets of $18B. The ETFs assets peaked on 6/22, the day before the Brexit vote. So, investors were moving money to the sidelines (or short term bonds) for months before the Brexit vote, at least in the case of BSV. Then, after the Brexit, money was taken out of BSV or short term bonds and redeployed into equities.
BSV – Vanguard Short-Term Bond ETF
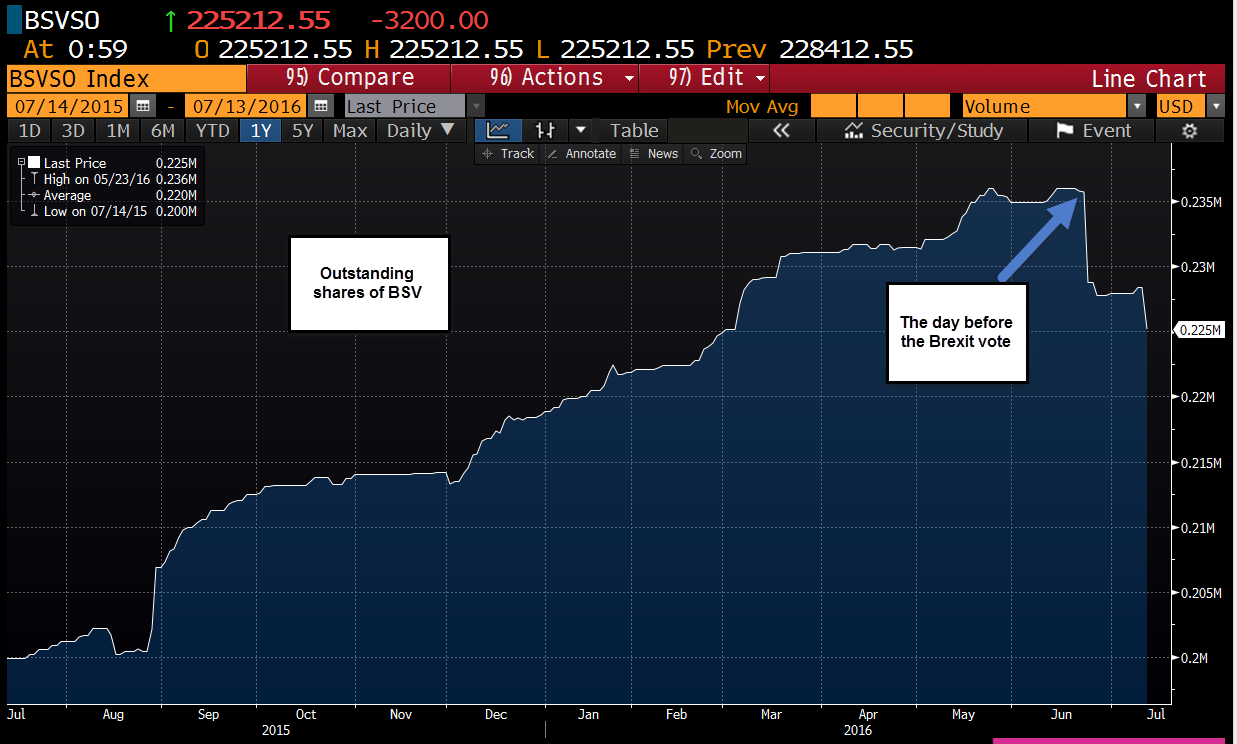
Source: Bloomberg
Finally, given the high level of assets in BSV, there is plenty of funds that can be redeployed into equities. For argument sake, let’s assume that cash does not come off the sidelines. There could be a sector rotation out of defensive groups and in to riskier sectors such as Technology, Consumer Discretionary, and Health Care / Biotech. As mentioned above, the Tech sector has seen $5.8B of ETF outflows in 2016. If money returns to the sector in the second half of the year, the group could be poised for a move higher.
One ETF that I like in the space is the RYT, the Guggenheim S&P 500 Equal Weight Technology ETF. This ETF has both small caps (ie STX, NVDA, ATVI, HRS, etc.) and large cap companies (FB, GOOGL, etc.) as it is equally weighted, meaning each company in the ETF gets the same weight. The chart below shows that the RYT ETF has recently broken out and has just reached an all-time high, and if money starts to flow back into the sector, the rally could just be beginning
RYT – Guggenheim S&P 500 Equal Weight Technology ETF, weekly chart
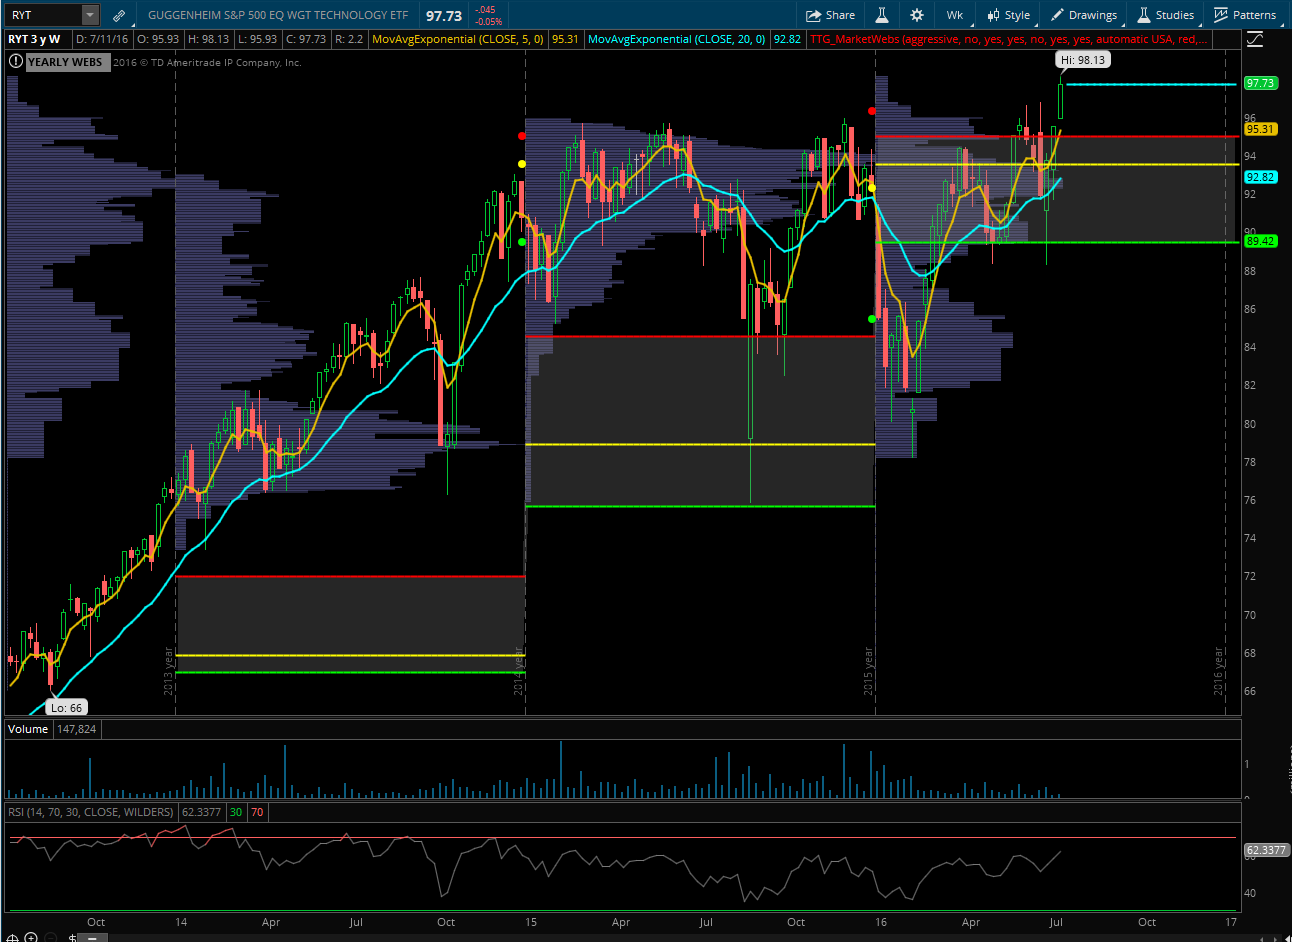
Source: ThinkorSwim
– Christian Fromhertz, CEO of The Tribeca Trade Group
Follow @cfromhertz on twitter for the latest trends in ETFs and Equity Options. Visit http://www.tribecatradegroup.com/ to learn more about his live trading room

